Women in STEM: a cross-country view
In my previous articles about the Google memo, I mentioned repeatedly the existence of an international gap in the proportion of women in STEM education. Some people criticised this, citing examples of, for example, United Arab Emirates, India, or Saudi Arabia. I tried to answer some of those critiques in previous posts, but I gather from some reactions that it wasn't very convincing, and I admit it was disorganised.
So here is a more structured exploration of that. The conclusion is still the same: Women are underrepresented in STEM (<40%) mostly everywhere, if we do our calculations the right way.
I got my hands on thisdataset from Unesco that contains many countries across time, and crucially,the % of women in STEM, and the % of women who choose STEM. Let's have a look at how things look initially. The dataset groups tertiary education fields into a bunch of categories. The ones of relevance to us are:
- Information and Communication Technologies
- Engineering, Manufacturing and Construction
- Natural Sciences, Mathematics and Statistics
And in addition they have
- Science, Technology , Engineering and Mathematics (As an aggregate of those, roughly)
In some datasets they have only the 3 former. When that happened, I aggregated them. My final sample has 874 observations, from 1999 to 2015, and covers a 122 countries, with around 40-50 observations per year (not always the same countries, and some are heavily underrepresented).
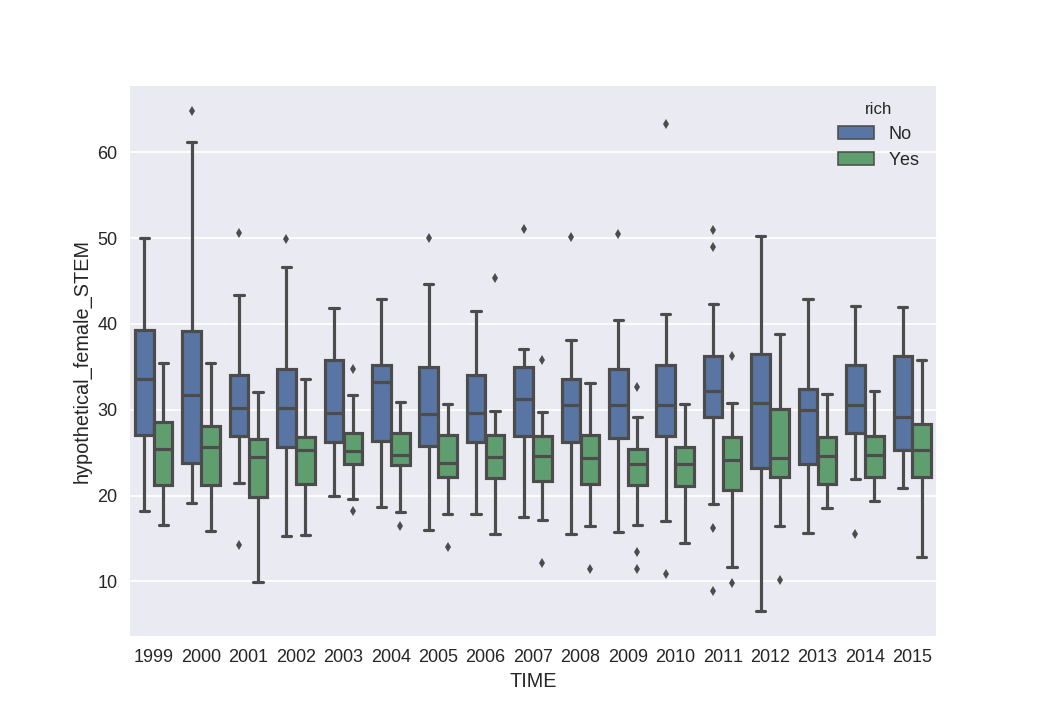
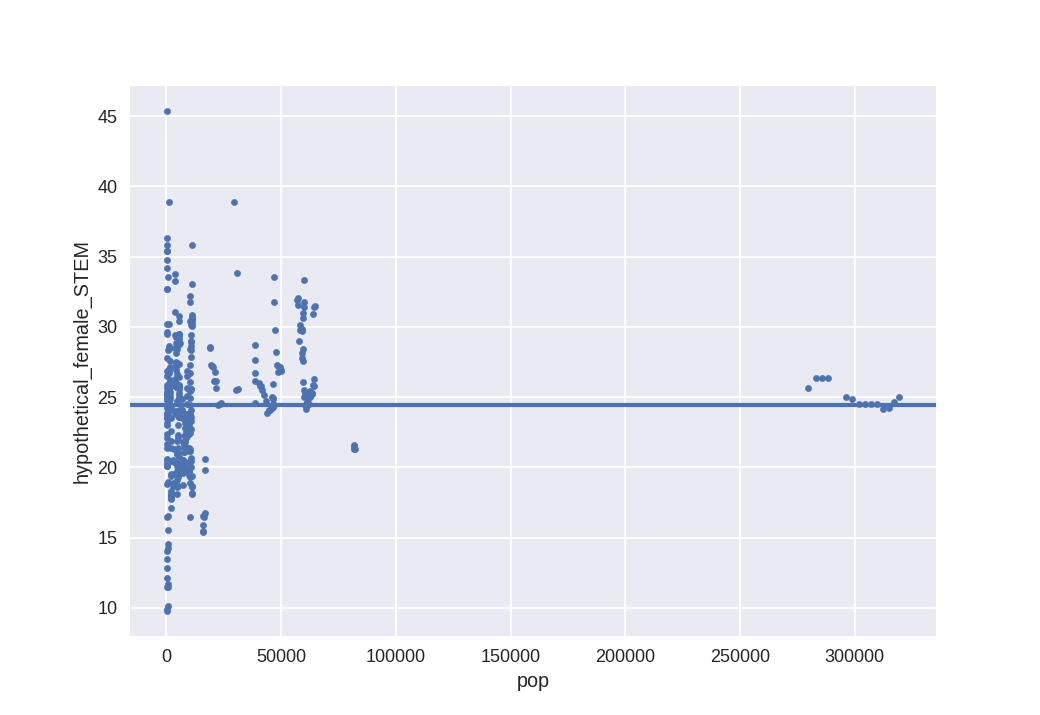
The first plot below divides observations by whther they are "rich" countries or not. In this case, "rich" means that log(GDPpc)>10, and that % of GDP from natural resources under 20%. The cutoff is at countries like Greece, Slovenia, or Poland.
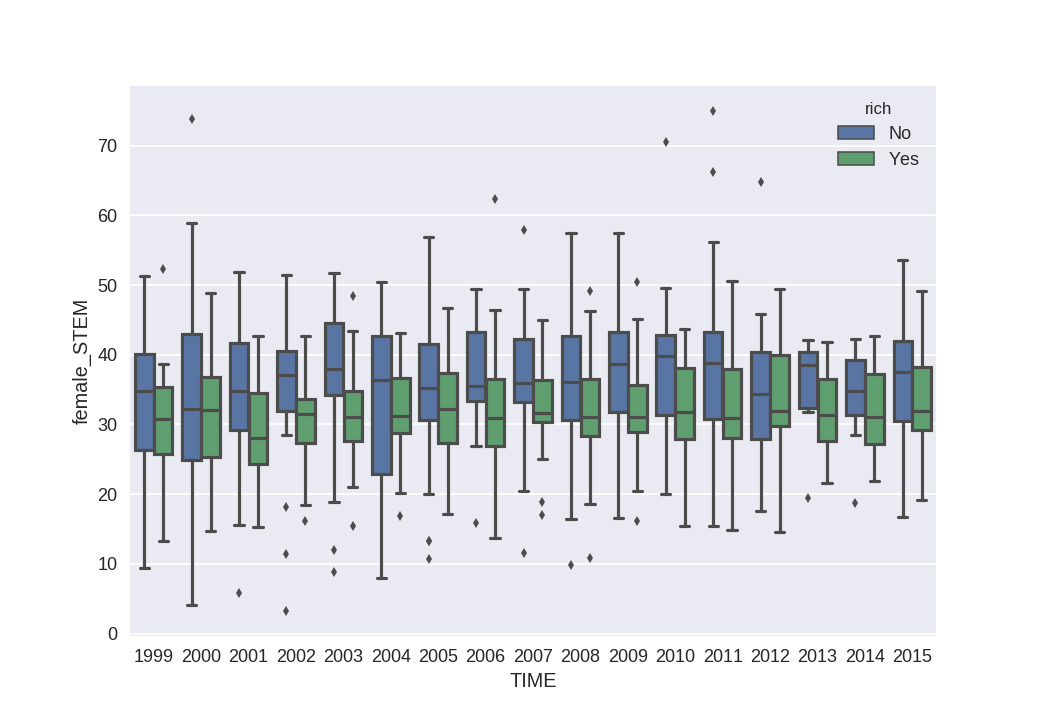
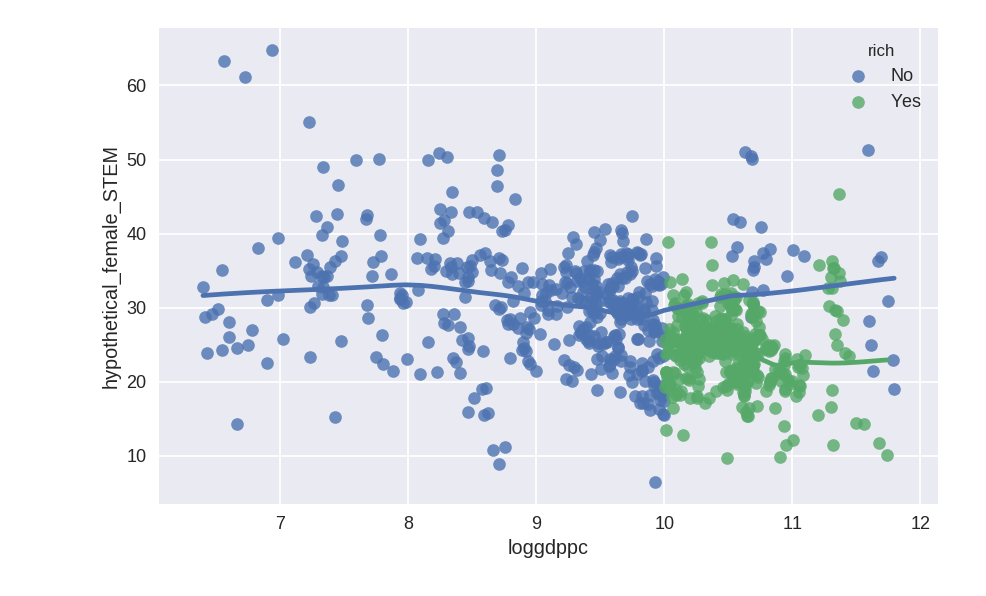
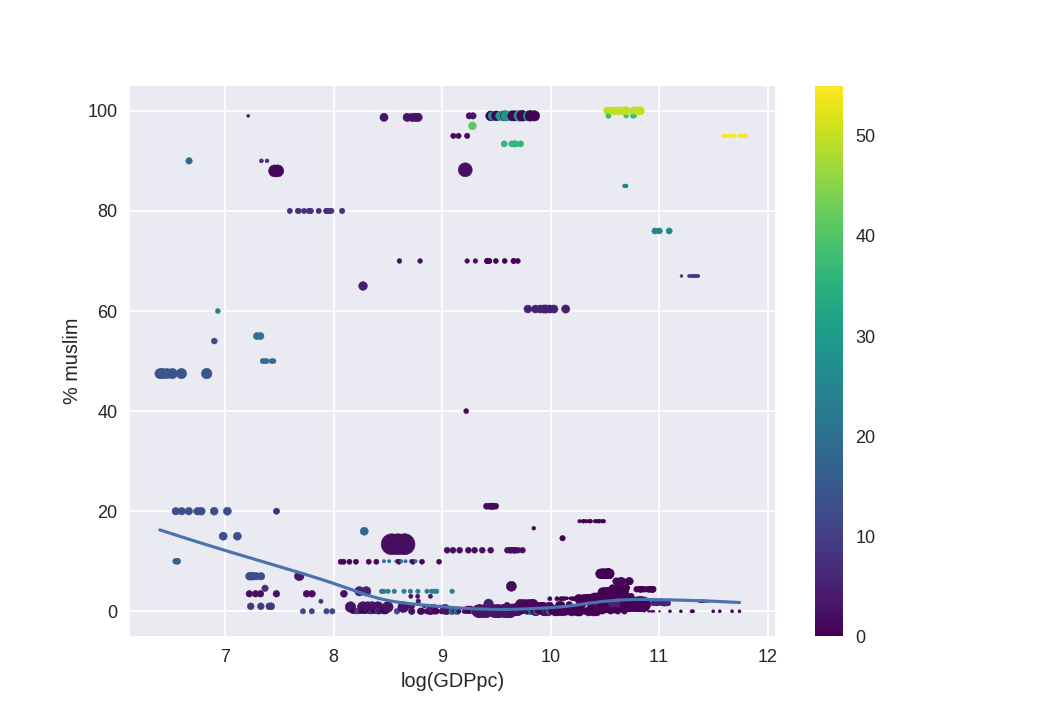
In both cases, medians are below 40, and rich countries show both a smaller mean and variability. It fits with OECD data that I have already discussed. By GDP, it looks like this (Each dot is an observation of a country in a given year, size of the dot depends on population):
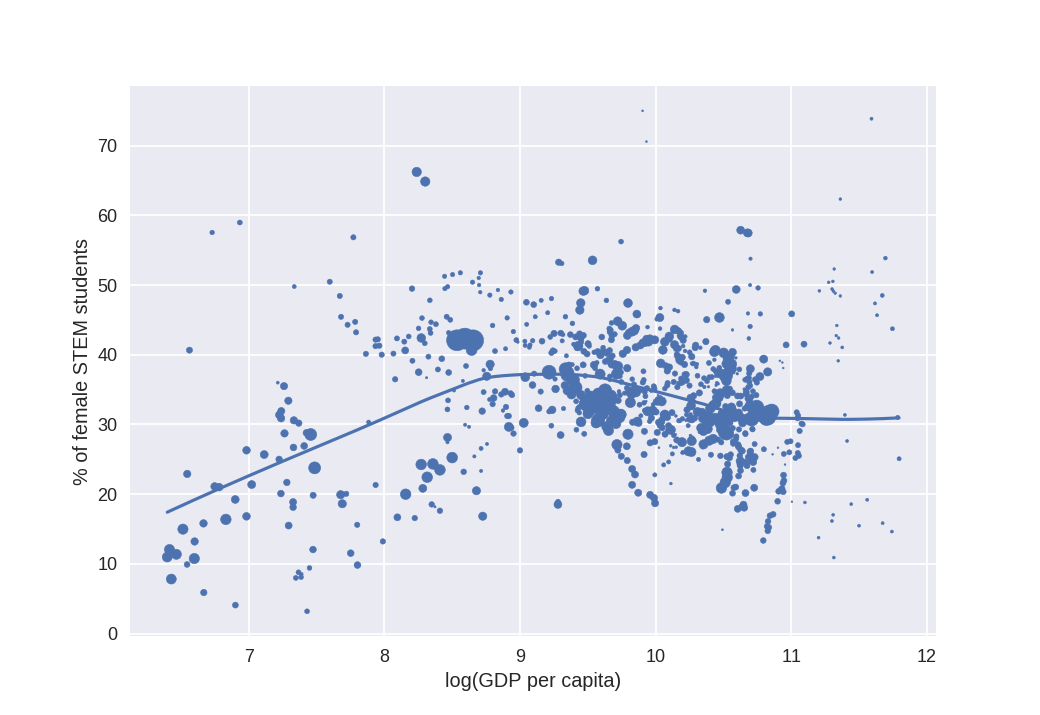
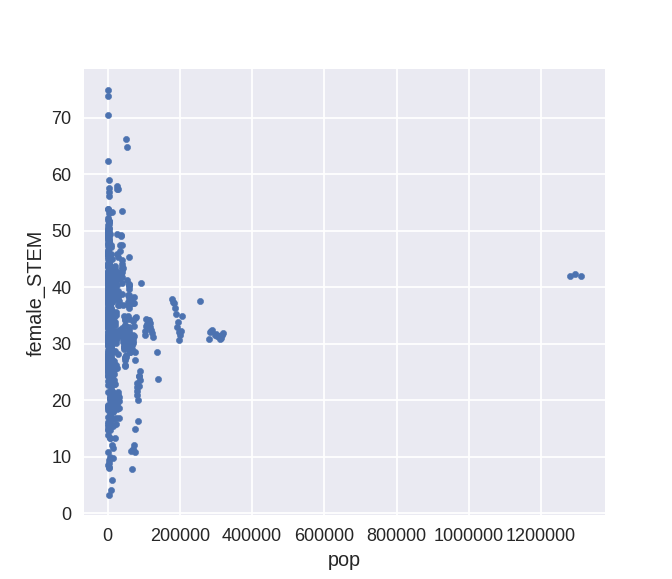
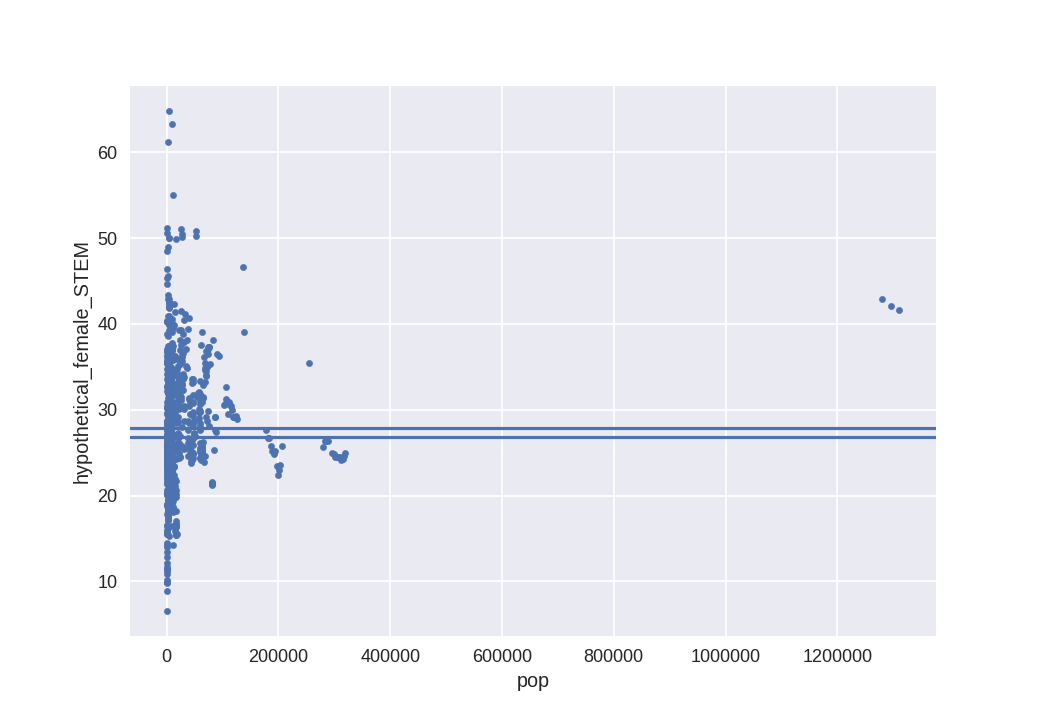
This suggest a pattern of increase and then decrease in the % of female students in STEM. There are many small countries in my sample that show high variability in the % that might be adding noise:
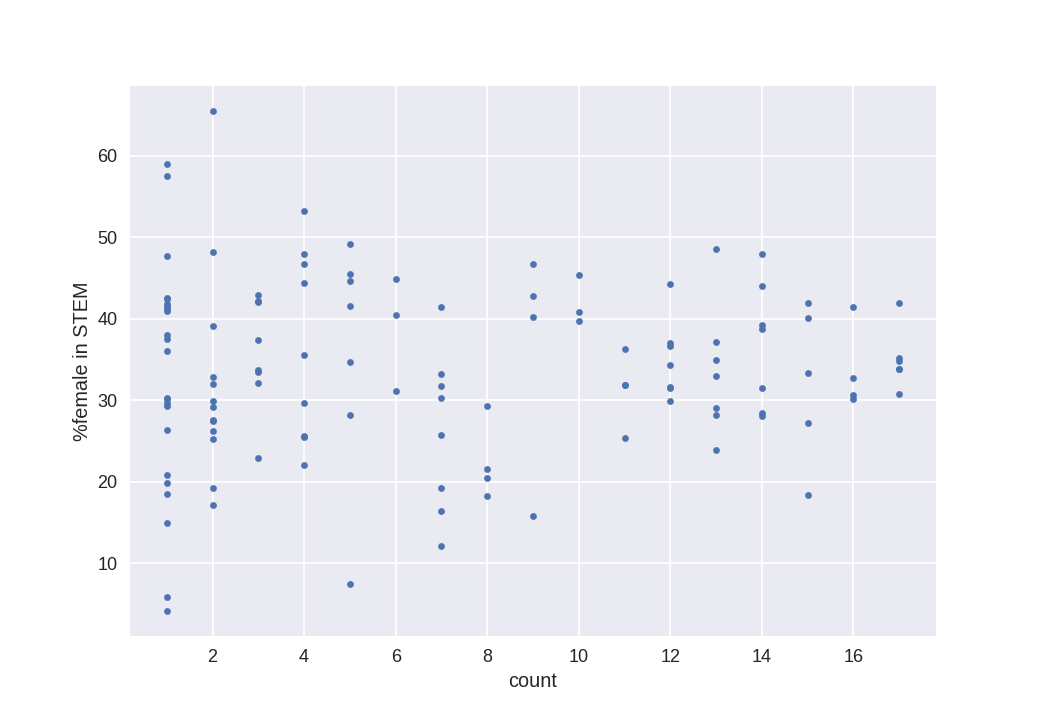
So yes, so it seems. Now, are there any country that, within its own time series, on average, is over 40? Yes, a few. I plot mean over the dataset, and the obervation count.
According to this, the countries at the top and bottom of the ranking are:
| female_STEM | |
|---|---|
| Country | |
| --- | --- |
| Myanmar | 65.543585 |
| Sierra Leone | 58.974360 |
| Liberia | 57.545090 |
| Antigua and Barbuda | 53.283025 |
| Algeria | 49.145176 |
| Mongolia | 48.623639 |
| Tunisia | 48.171220 |
| Bahrain | 48.013888 |
| Brunei Darussalam | 47.911507 |
| Grenada | 47.670250 |
| Oman | 46.778222 |
| Qatar | 46.775434 |
| Uruguay | 45.484430 |
| Saudi Arabia | 45.380228 |
| Netherlands | 20.456234 |
| Benin | 19.837320 |
| Kenya | 19.276040 |
| Mozambique | 19.236314 |
| Iraq | 18.521590 |
| Switzerland | 18.417970 |
| Lao People's Democratic Republic | 18.264617 |
| Burkina Faso | 17.181350 |
| Cambodia | 16.414561 |
| China, Macao Special Administrative Region | 15.756433 |
| Aruba | 14.893620 |
| Ethiopia | 12.048119 |
| Eritrea | 7.492512 |
| Niger | 5.882350 |
| Chad | 4.081630 |
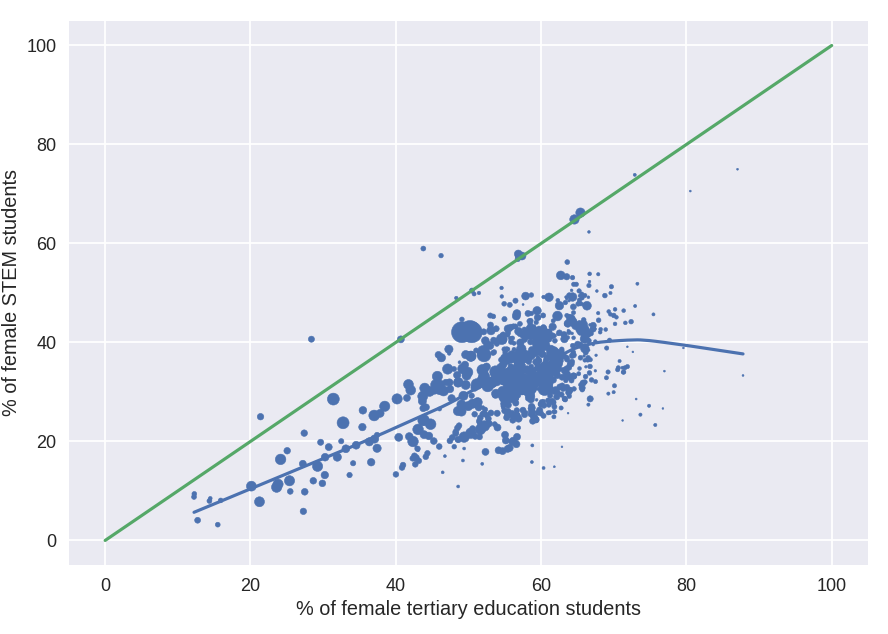
This is a substantial amount of variability that needs to be explained. I tried looking at different things, and in the end I found a first explanation: Women are not equally likely to attend university in all countries. In other words, if 90% of your students are female, then even if a tiny proportion choose STEM, they will outnumber men. To correct for this, I calculated the hypothetical gender proportion in STEM that we would observe if 50% of total university graduates were female. I did did by getting which % of men go to STEM, and which % of women go to STEM. With those two values, assuming equal number for both, their quotient gives us how many men per women would be in STEM, and from that one can get the hypothetical proportion.
I think this is important to see what men and women are really choosing, and avoiding the % of female who attend uni from corrupting our results. I plot both variables below, along with a line of equiproportionality. And as you can see, in almost all cases, every single observation falls below it: once we account for % of female students (and a few outliers that I'll discuss), the % of females in STEM tends to fall.
As before, let's break it down by wealth:
Here rich means the same as before. Those dots above 40 at the right of the chart are oil-rich arab countries like Qatar or Saudi Arabia.
That one rich country (The others are mostly oil-rich arab states) that appears above 40 is Brunei Darussalam in 2006. Let's see how it has evolved:
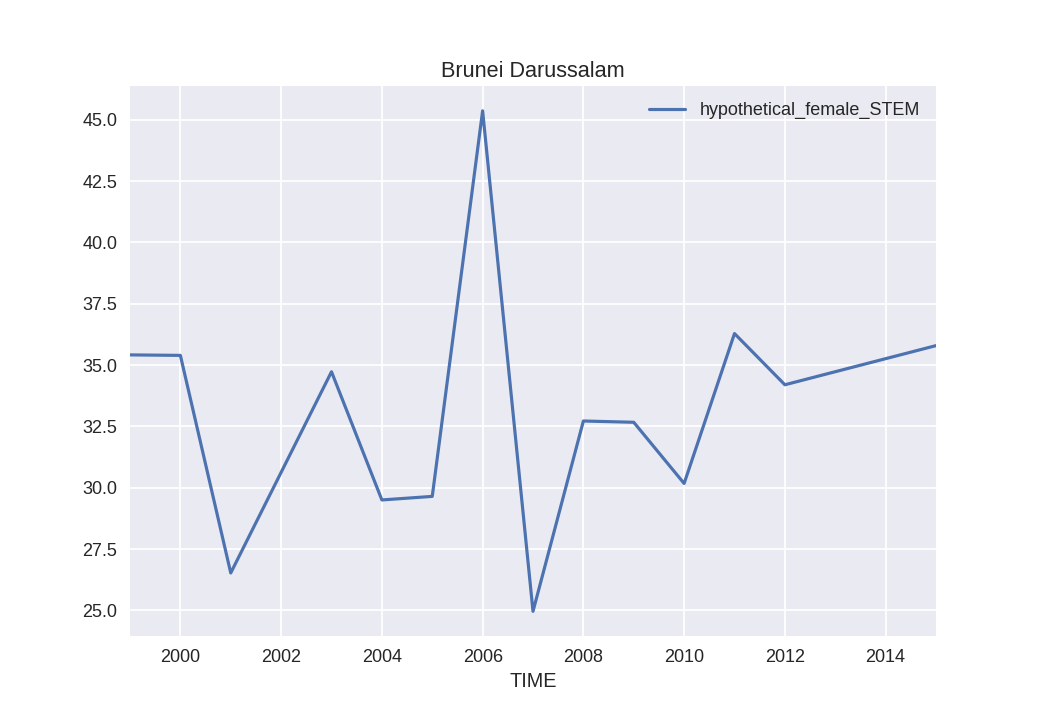
Clearly an outlier. Brunei has a small population, 350.000 people in 2006. So we establish the claim that: In no developed country, since 1999, the % of women in STEM has been above 40%, if we assume parity in access to university. Can we generalise to other countries? (This is STEM, not engineering, note)
Let's look at all the countries that were above 40% in any given year. If we do that, we get this full list: Burundi, Liberia, Sierra Leone, Cambodia, Gambia, Eritrea, Bangladesh, Kyrgyzstan, Angola, Myanmar, Palestine, Samoa, India, Swaziland, Morocco, Grenada, Algeria, Azerbaijan, Panama, Oman, Saudi Arabia, Brunei Darussalam, Qatar.
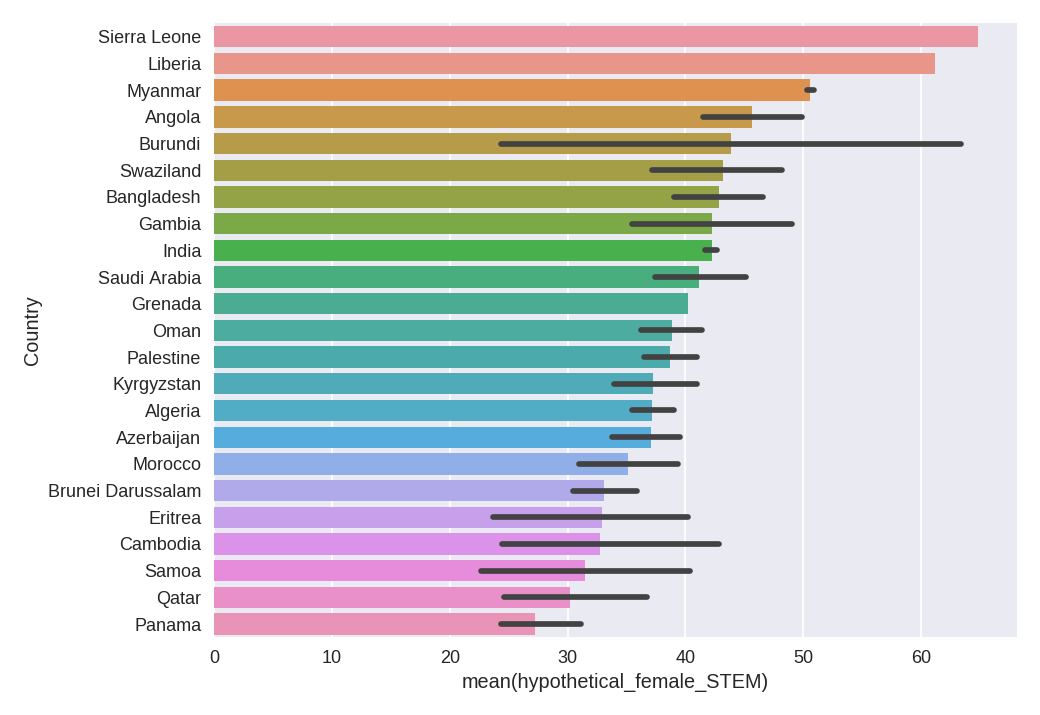
Some of these countries have only a few datapoints. If we discard those with just two observations or less (Algeria, Bangladesh, Burundi, Gambia, Grenada, Liberia, Myanmar, Samoa, and Sierra Leone), and on top of that we discard the ones that are under 40% on average, we are left with Saudi Arabia, India, and Swaziland. They look like this:
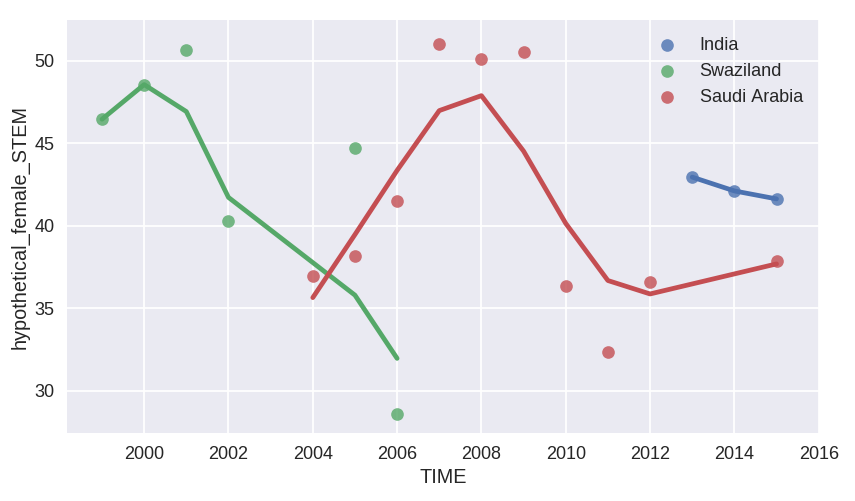
Now these need an explanation. India was discussed in a previous post of mine, as was Saudi Arabia. Swaziland has a population of about 1 million people, and I cannot really find any data for an increase in stereotypes against women in that period. It could be noise, or it could be an actual trend. This sounds like we could have a look at the countries with the most number of data (Over 15 datapoints).
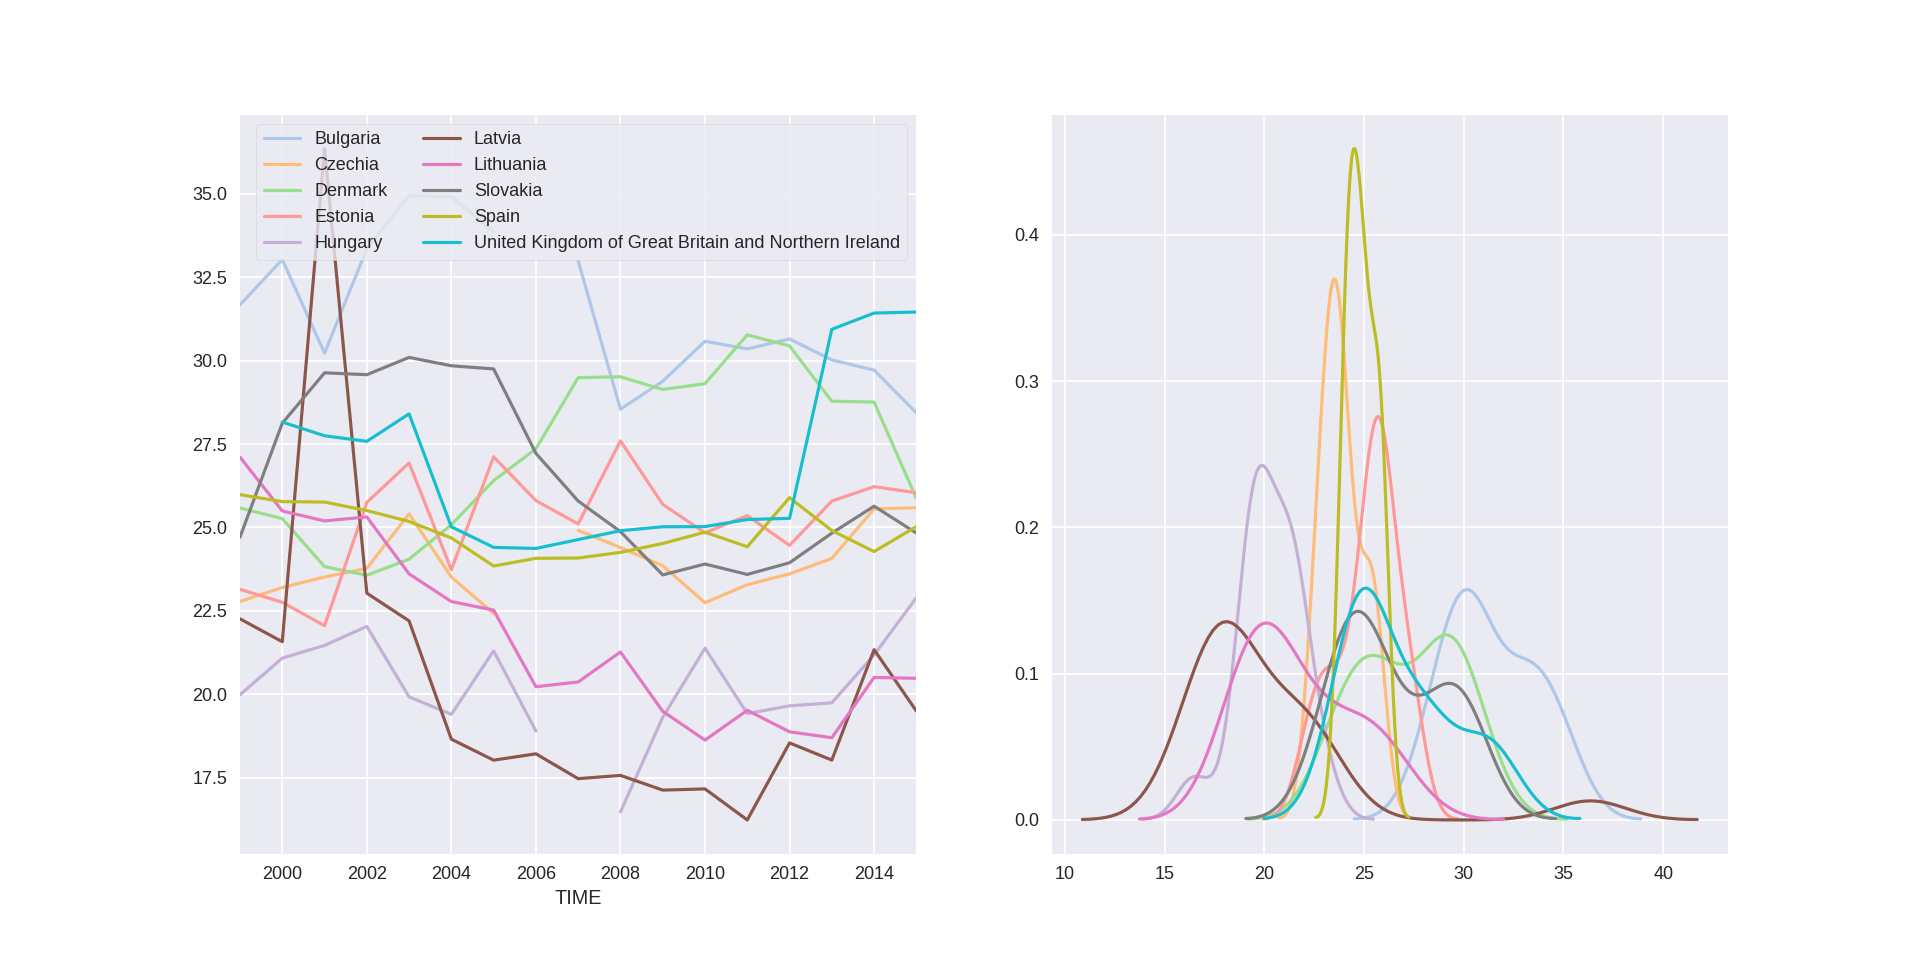
What happened in the UK! OECD data also says that there was a jump of 9 points between those two years in the science, mathematics, and computing subfield. I would think that this is due to a redefinition of the data, but go guess.
Now, within the developed countries, how variable is each of it, compared to each other:
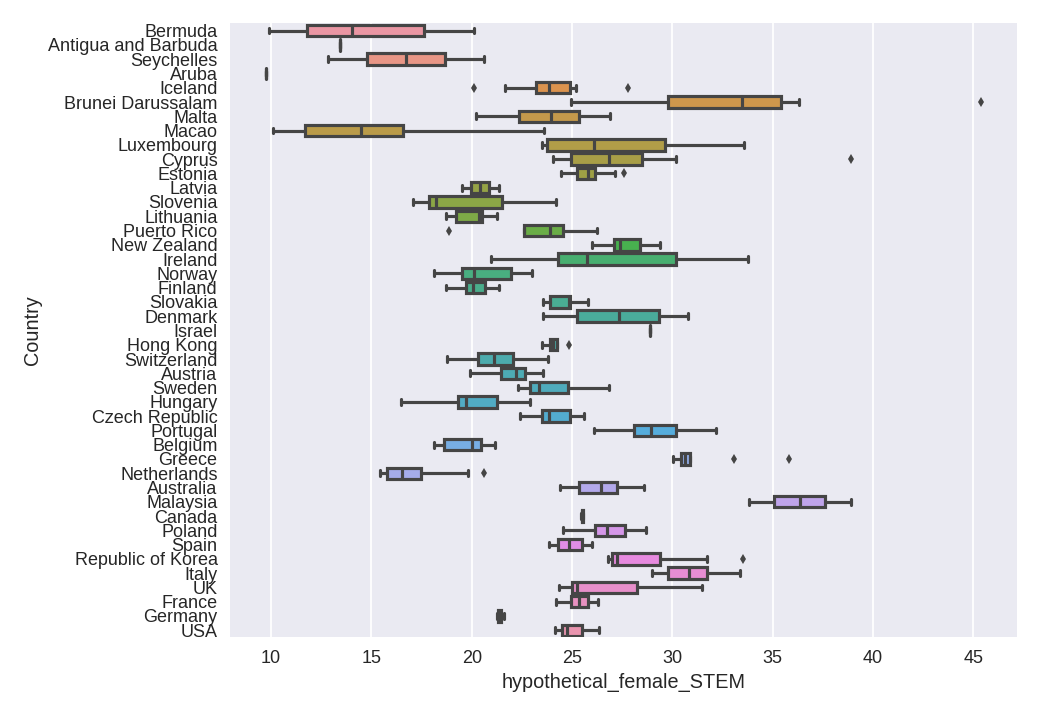
The countries are sorted by increasing population. Again there is decreasing variance with population (blue line is both mean and median, as they are almost the same here)
If we accept that much of the variance within countries is noise, then we can return once more to the full view,
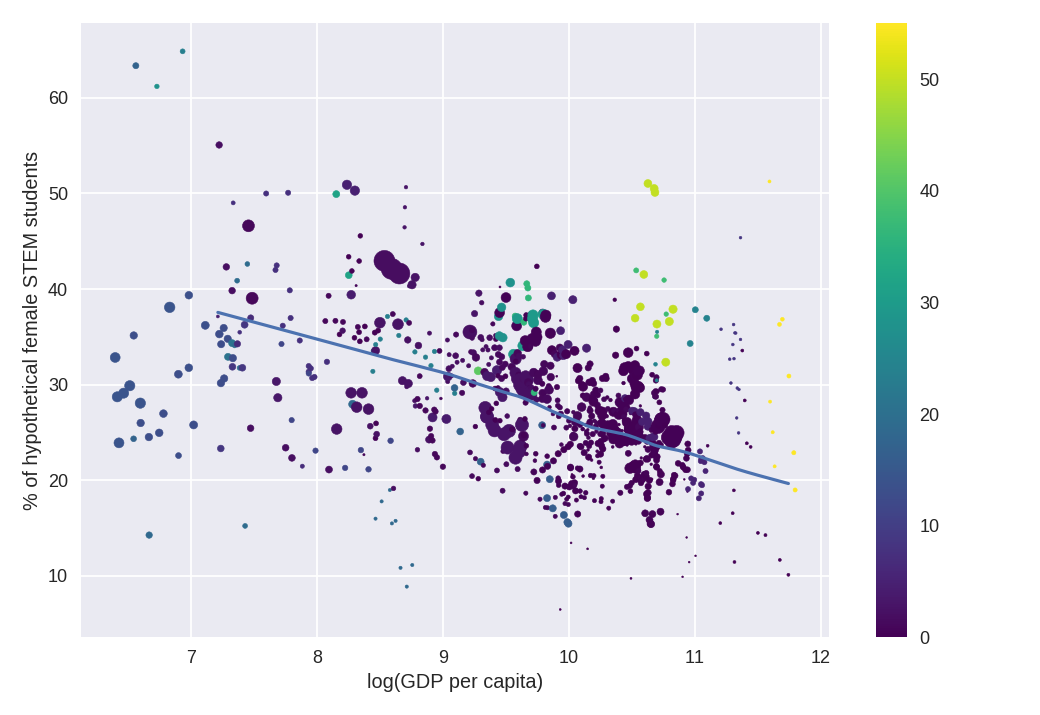
Again, India(!). India tells us something that we knew: That there is a relation between GDPpc and % of females in STEM. India should be good estimate of what the % should be for a country of its GDP, given its population.
Finally, we can return to the relationship between development (as proxi'ed by GDP) and % of women in STEM. The fit is excluding those countries with natural resource rents over 20% (value that is in the colorbar).
Lest you think that maybe I'm obviating a %muslim-women in STEM correlation:
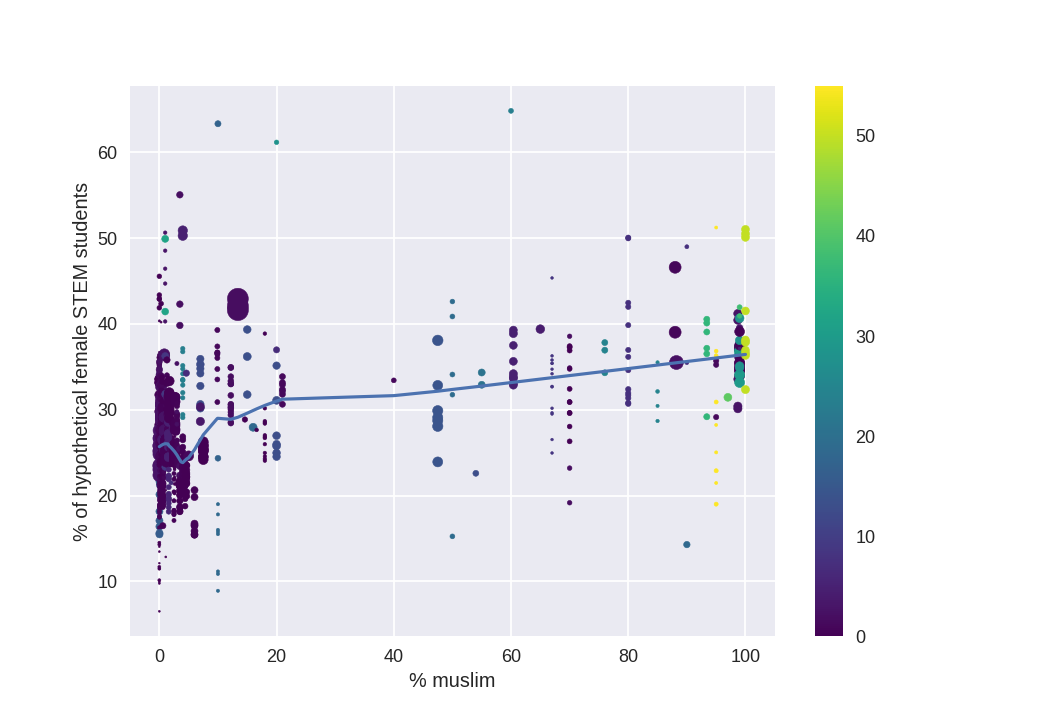
But this could be driven by a muslim-GDP correlation, which in turn is correlated with females in STEM.
To stop here and sum up: the point is that many of these (and others) variables are correlated. I have included fm_STEM, and fm_EDU, the women to men ratio in STEM and in education and healthcare, equality_index, the OECD SIGI index of women discrimination, Nrrent, the fraction of GDP that comes from natural resources, and IQ, collected from the most up to date and cross-nationally valid dataset (NIQ-dataset.
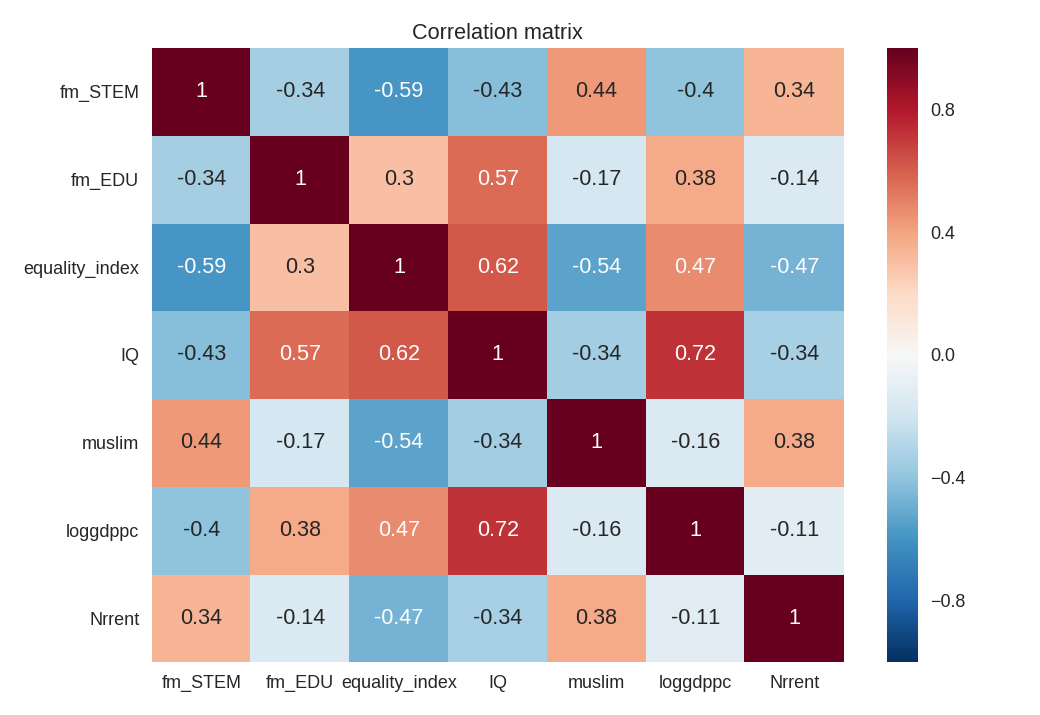
One approach to this would be to do multivariate OLS, but this makes it difficult to deal with collinearity. We could instead do OLS on some variables, then take the residuals and do more OLS to control for causally antecedent variables. But that would take time, and here we may have causality running in many directions. For this I chose to model the causal influence of the variables using SEM (Structural Equation Modeling). With this, one defines the set of relations that one expects the data to have, both cause and correlations, and the solver tries to find the coefficients that make the model most resemble the observed values.
The model in particular that I'm using is:
- Development (latent variable) explains life expectancy, log(child mortality), log(GDP per capita) and IQ.
- Share of muslims covaries with development (direction not specified)
- Equality, as measured by OECD's SIGI depends on development and share of muslims
- The % of women in tertiary education depends on development and equality
- The ratio of % of all women in tertiary education who choose STEM to the % of all men in tertiary education who choose STEM (female_over_male) depends on development and equality. A preference ratio of 1 means that men and women choose STEM in equal proportions. Higher ratios mean that women are more likely than men to choose STEM.
- GDP per capita is corrected by substracting the share of natural resources from total GDP.
I have 3023 observations, but many empty items. For example, only 8.4% of the entries (two years) have an equality index, and 20-25% of all rows have the female_over_male variable. The model is estimated usingmaximum likelihood with robust standard errors , and full information estimation so that for each pair of variables, all rows with entries are considered. The correlations are similar if I only use complete rows. The result, considering only statistically significant (p<0.05) correlations is:
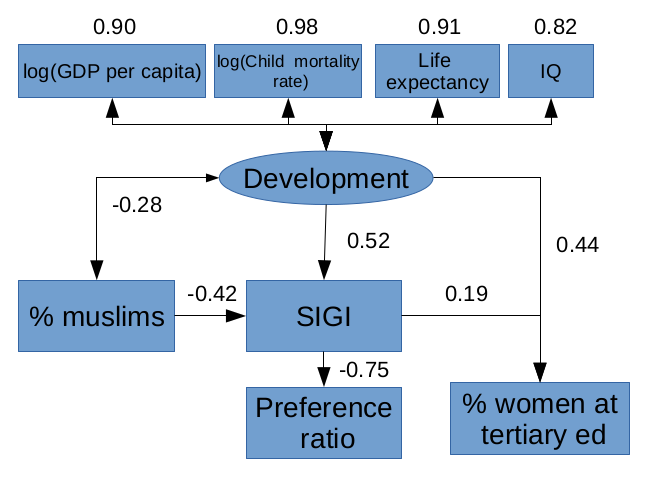
The values there are standardised coefficients (read as: an increase of 1 standard deviation in variable A leads to an increase of X standard deviations in variable B), and the values above the components of development are the loadings of those variables into the development latent variable.
In other words, development in and of itself does not predict changes in the preference ratio. But equality does, and it does predict it negatively. For muslims, the reason women are overrepresented there does not have to do with an effect of % muslim itself, but an indirect effect via less equality.
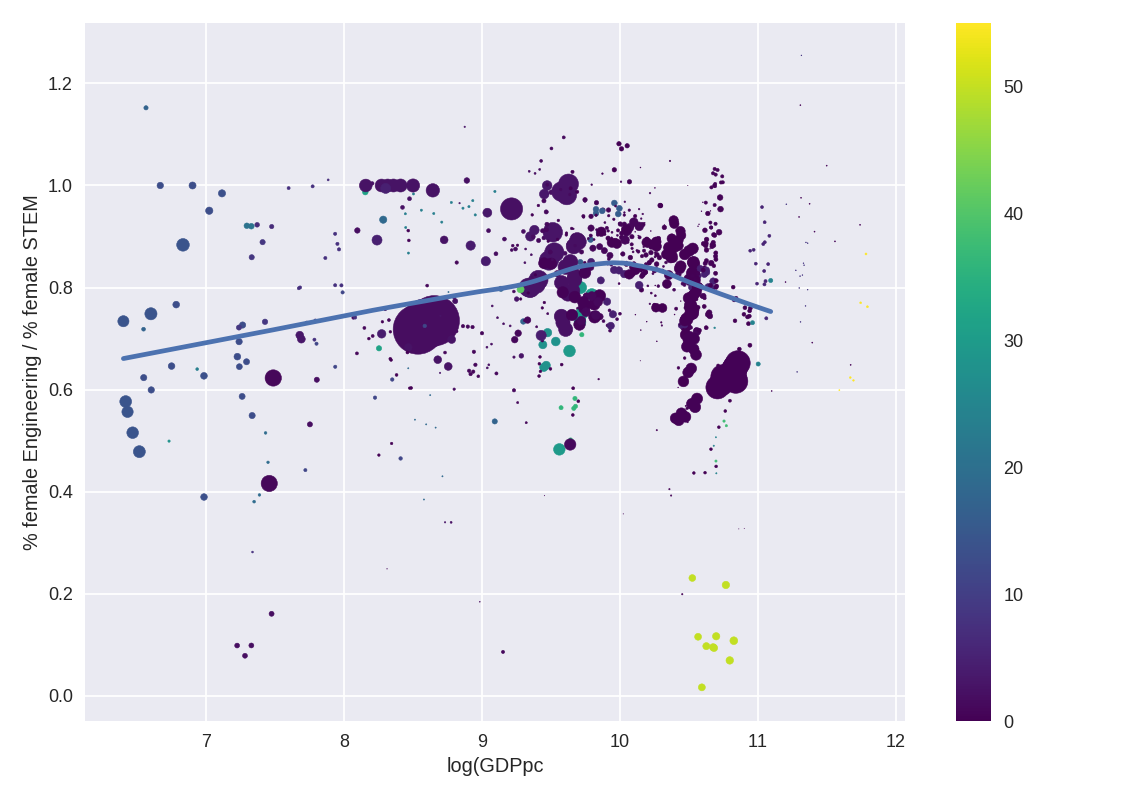
Engineering
The discussion above is for STEM. But what about engineering in particular? Engineering tends to feature bigger gaps than STEM in general, and so studying how the gender gap in engineering differs between countries. I also have data for that, and so I offer a few plots.
First, the relation between STEM and engineering (using my hypothetical variable):
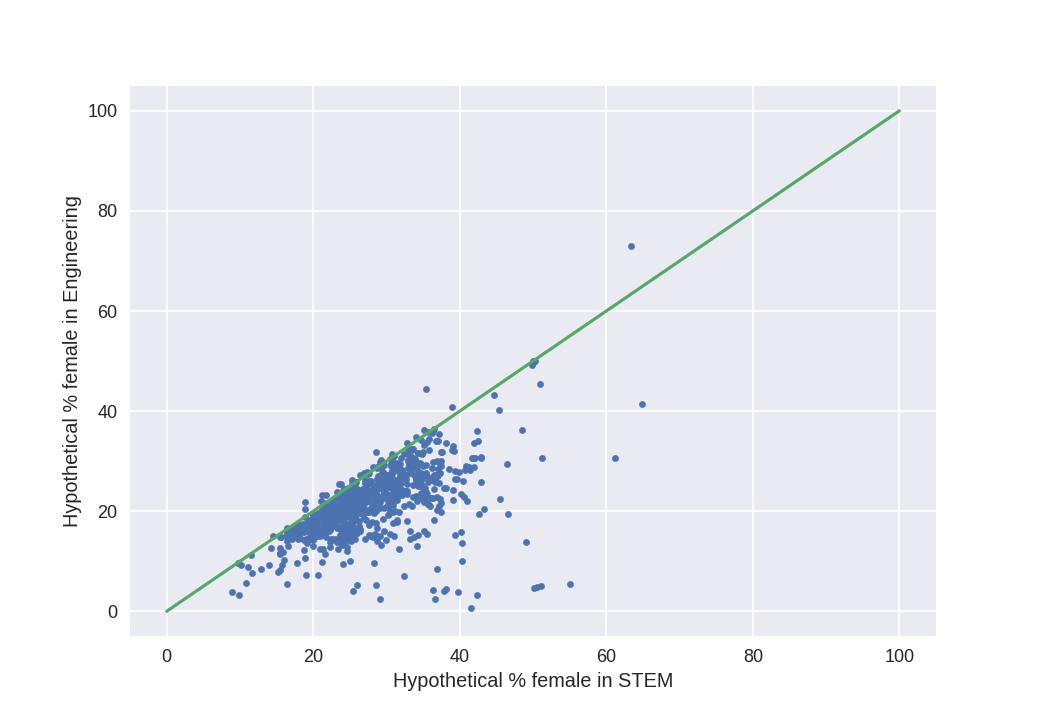
This means that, as expected, there is a relationship between both, but that it is almost never the case that the % female in engineering in an observation is greater than % in STEM. This may indicate that within STEM, everywhere in the world, women are clustering in other subjects. Let's define a Engineering /STEM ratio and see how it behaves wrt GDP,
Including the hypothetical % of female in Engineering in the structured model above yields a significant correlation only for development (d=-.26), and this effect is direct, not mediated by equality, unlike for the % of female in STEM.
Full data for this section can be found here in csv format. There are more variables in the dataset, feel free to ask in the comments if you really want to know.
Conclusion: Countries to pay attention to
The key takeaway from this post, in my opinion, is a list of countries that do not match the trend, in some sense. These countries should be studied to understand the causes of the differences between them.
One group of countries is Saudi Arabia and the United Arab Emirates. These are low-equality, high income, high % muslim countries that have a relatively high share of women in STEM.
A second group of countries is Switzerland and Netherlands, rich western countries high in equality, and with relatively low %. (We may add in Macao here)
A third group, Italy, Malaysia, and India, countries that have a relatively high share of women in STEM, especially Malaysia. (Malaysia, like India, however, has a smaller share of women in STEM related industries. Where are those women going?)
A fourth group, low income countries with few women in STEM, like Chad, Niger, or Iraq.
Finally, a sixth group with reference countries that we may take as developed, but with different cultures: Sweden, Denmark, Japan, South Korea, the UK, and the US.
Bonus: Sociological explanations
A bit unrelated to the main topic of the post. I thought of splitting this post in two, but in the end I decided to go for one.
Sociologists are not blind. They know there are international differences in female/male choices of major, but they tend to propose explanations that are culture-based. I copy some bits from a recent review, by Maria Charles (2011), below. The review deals with more things than women in STEM, but I focus on what interests us here.
Although some degree programs—most no tably business, law, and medicine—have integrated over time, gender distributions across fields have changed rather little since the 1980s in the United States and other industrial countries (Bradley 2000; Jacobs 1995, 2003; Xie &
Shauman 2003, England & Li 2006). Moreover, cross-national analyses reveal weak, sometimes negative relationships between socioeconomic modernization and female representation in the mathematical and technical fields that are so strongly male-typed in the industrial West to- day (Charles & Bradley 2002, 2009; Charles 2011). For instance, women are about as well represented in computer science programs in Turkey as in Sweden (Charles & Bradley 2006; see also Lagesen 2008 on Malaysia).
And in engineering programs, women’s presence is, in fact, stronger in developing than in advanced industrial societies. Figure 2 depicts this relationship for a sample of 44 countries. It shows a negative correlation (−0.48) between GDP per capita and female representation in engineering. [..]
The patterns described above beg two questions, which are considered in the following sections: Why do we see equalization on some indicators but not others? And why are some curricular and career outcomes more gender-typed in advanced industrial countries?
Evidence is growing, in fact, that some of the same structural and cultural forces that have facilitated female access to labor markets and educational systems have also contributed to sex segregation within these institutions.
In higher education, simultaneous historical pressures toward increased female participation and sex segregation are clearly evident in policy agendas and official discourse. Since the middle of the twentieth century, national governments and international organizations have endeavored to increase female enrollment in colleges and universities by implementing programmatic changes designed around prevailing gender stereotypes (Charles & Bradley 2002, Bradley & Charles 2004). In 1953, the following resolution was directed toward national ministries of education by the United Nations Educational, Scientific and Cultural Organiza- tion. UNESCO (1953, p. 263) resolved
that to facilitate women’s access to higher education and the use of their abilities for the greatest good of society, university studies permit women to specialize in fields particularly suited to feminine aptitudes and assure them more adequate training for the new careers now being opened up to them.
That may have been the case in 1953. But is it the case in recent decades? If anything, there is now a strong push towards equality, especially by increasing the share of women in STEM. I suppose that the reason why there are no calls for equalisation in female-heavy fields is that those fields tend to be less lucrative or useful, and so from the perspective of a pure profit maximiser without any taste, irrational. If one assumes that tastes are equal, then men are doing the right thing, but women are not due to stereotypes, and so it is them, not men, who have to be nudged towards STEM.
WHY ARE CAREER OUTCOMES MORE GENDER-TYPED IN ADVANCED INDUSTRIAL CONTEXTS? One obvious response to this question is that people who live in affluent societies can more easily absorb the material costs associated with pursuit of female-typed occupational and educational careers. In other words, the economic capacity to indulge stereotypically female preferences is greater in advanced industrial contexts.[This interpretation is consistent with findings from individual-level research in the United States. For example, American girls who come from high-income families are less likely to study math and science in college (Ma 2009). {But note that there are also contrary findings, this deserves future exploration (Author note}] **Some scholars object to explanations of **sex segregation that reference women’s preferences and choices because this line of inquiry seems to divert attention away from the structural and cultural causes of inequality. But acknowledging gender-differentiated aspiration does not blame the victim unless preferences are considered in isolation from the social contexts in which they emerge. This explanation does not require that gendered dispositions be innate or even deeply internalized. As discussed above, educational and career aspirations are shaped by beliefs about one’s own competencies and affinities, beliefs about the masculine or feminine task content of specific social positions, and beliefs about the categories of persons who are appropriate incumbents for such positions.
These beliefs constitute the cultural environment in which life choices are made, and they may be a consequence, not only a cause, of sex segregation.
Aspirations are also shaped by more general beliefs about the nature and purpose of educational and occupational pursuits. In advanced industrial societies, parents and educators commonly exhort young people, and perhaps girls in particular, to “follow their passions” and to study and work in fields that will allow them to realize their “true selves.” Although these so-called postmaterialist values are spreading globally, they are today most clearly evident in affluent, late-modern societies (Inglehart 1997, Inglehart & Baker 2000, Meyer & Jepperson 2000, Beck & Beck-Gernsheim 2001). **Curricular and career choices become more than practical economic decisions in these contexts; they also represent acts of identity construction and self-affirmation. Because gender remains such a fundamental axis of human identity, individual self-expression often results in “expression of ****gendered selves**” (Charles & Bradley 2009).
Normative mandates for self expression intensify sex segregation by supporting the development and realization of culturally masculine or feminine aspirations. In the process, stereotypes and gender identities are entrenched, gender labeling of educational and occupational fields is reinforced, and sex segregation is legitimized. For example, American girls who aim to “study what they love” are unlikely to consider male-labeled science, engineering, or technical fields, despite the relative material security provided by such degrees. The nonalignment of mathematics and science with female gender identities may even generate attitudinal aversion in these postmaterialist contexts. New evidence suggests that boys’ and girls’ attitudes toward mathematics indeed diverge more in developed than in developing and transitional societies (Charles & Bradley 2009).
High levels of sex segregation in advanced industrial countries are also supported by structural features of labor markets and educational systems, as discussed above. Such features include large service sectors and diversified systems of higher education. These have appeared worldwide, but the transformations began earlier and have so far been most pronounced inaffluent European and North American countries (Benavot 2006).
In other words: Sociology says that women do prefer more STEM. But in developing countries there is a smaller gap due to economic factors. And preferences are socially constructed, so people "freely choosing" means "people freely expressing what society has taught them to express".
Another article (Mann & DiPrete, 2013) discussed the gap, and it mentions many of the key points already discussed in this blog: that women show a stronger preference for liberal arts, that high ability women tend to have higher verbal ability than high ability men. The paper neither affirms nor rejects a possible biological origin of those differences in preferences.
Bradley & Charles (2009) specifically try to address cause of segregation by field by analysing 44 countries.
We argue that conventional evolutionary models of women’s status cannot provide a satisfactory account of cross-national and historical variability in sex segregation by field of study because they underestimate the enduring cultural force of gender-essentialist ideology (i.e., cultural beliefs in fundamental and innate gender differences), which has proven to be extremely influential in shaping life experiences, expectations, and aspirations, even in the most liberal egalitarian societies (Fenstermaker and West 2002; Charles and Grusky 2004; Correll 2004; Ridgeway 2006). The segregative effect of gender-essentialist beliefs is intensified, moreover, by a strong Western cultural emphasis on individual self-expression and self-realization that has been diffusing worldwide since World War II (Meyer and Jepperson 2000; Frank and Meyer 2007) and is today most clearly evident in affluent late-modern societies (Inglehart 1997; Beck and Beck-Gernsheim 2001). [...] Contrary to the predictions of many evolutionary theorists {In a sociological sense}, we find a general tendency for greater segregation of academic fields in more economically developed contexts. [...] Sex segregation by field of study derives its legitimacy not from norms of male primacy, but from its seeming homology with gender-essentialist beliefs and dispositions. It is therefore less politically and socially contested than are many types of vertical inequality, and it is easily reconciled with self-expressive value systems. In fact, this type of sex segregation may not even constitute “inequality” in Inglehart’s strict sense. [...] In sum, the results of our pooled 44-country analyses suggest that (1) the association of sex segregation with economic development revealed in figure 1 is at least partly attributable to cross-national differences in economic structure (i.e., postindustrialism) and (2) aggregate-level gender differentiation in affinity for mathematics does help predict female representation in math-intensive fields (especially in math and the natural sciences). [...] Consistent with our argument positing positive feedback effects between sex segregation and gendered curricular affinities, the descriptive statistics displayed in table 2 reveal a significantly larger gender gap in expressed affinity for mathematics in advanced industrial than in developing/transitional societies (t-ratio p 2.15; P p .037). In the former group, the percentage of girls who claim to “like math” or “like math a lot” is on average 5.42 points lower than the percentage of boys who make this claim. This gap is only 2.05 points in developing/transitional societies. As can be seen in table 5, large, statistically significant differences between the country groups also exist on related indicators, including gender gaps in professed affinity for science (“I like science”) and aspirations for math-related careers (“I would like to work in a job involving mathematics”). These gaps do not correspond to simple differences in girls’ mathematical achievement; in fact, table 2 shows that the math achievement gap is slightly smaller in the more economically developed countries.26 The mean differences shown in table 5 provide preliminary evidence that national prosperity and the rise of self-expressive value systems promote development (or expression) of gender-differentiated curricular dispositions. The causal processes underlying cross-national variability in such dispositions among women and men is an important area for future research.
In developing and transitional societies, multivariate models confirm a net tendency for greater segregation as per capita GDP increases. We suggest that economic modernization does not have the degendering effect that modernization scholars expect because realization of any preference for lower-paid female-typed careers is more constrained (and less culturally legitimate) under conditions of greater scarcity.37 From this perspective, increasing sex segregation may reflect decreasing normative and material pressures for university-educated persons, regardless of gender, to obtain credentials in lucrative scientific and technical fields and to build human capital in fields (like engineering and the natural sciences) that are deemed crucial for national development and competitiveness in the international economy. In other words, instrumental goals of material security and national economic development are decreasingly central to curricular decisions (by students themselves, parents, family members, and educational gatekeepers) as national prosperity grows. But this segregative GDP effect is measurable only up to a point. Among advanced industrial societies, further increases in national prosperity (GDP) do not exert a segregative effect on curricular distributions because existential security is now widely taken for granted at the mass-societal level. Strongly diversified university curricula are commonly celebrated as instruments for individual self-realization in these contexts. Sacrificing material rewards in order to pursue a passion (or presumed passion) is more culturally legitimate—especially for women, who are generally not expected to be primary breadwinners. As individuals seek to express their essential (male and female) selves, the gender labeling of academic fields intensifies, and distributions across these fields become more closely aligned with gender-specific curricular dispositions.Crossnational variability in girls’ relative mathematical affinities (rather than variability in economic capacities to realize such affinities) thus becomes a decisive determinant of gender distributions across curricular fields in advanced industrial segregation regimes.
Finally, as to ways of reducing the gap, they suggest, among other things, to force girls to study more maths and science related courses
Previous comparative and historical research provides evidence thatlimitations on curricular choice—either through universal requirements for math and science coursework throughout secondary school or through stronger reliance on merit-based curricular placement—results in stronger representation of women in scientific and technical fields and a weaker influence of peers on students’ educational aspirations (OECD 1986; Barinaga 1994; Hanson, Schaub, and Baker 1996; Buchmann and Dalton 2002).41 Such restrictive educational policies are strongly at odds with practices in the United States and many other advanced industrial societies, where high-level math and science are optional and “freedom of choice” is widely celebrated (Frank and Meyer 2002; Schwartz 2004). But social pressures to conform to gender norms often peak during adolescence (Entwisle and Greenberger 1972; Gaskell 1985). Allowing girls to opt out of science and mathematics courses during their teenage years increases sex segregation in higher education by limiting subsequent curricular options (Charles et al. 2001; Xie and Shauman 2003), by reducing the likelihood that a stereotype-eroding critical mass of high-achieving girls will be attained in male-typed programs (RiegleCrumb, Farkas, and Muller 2006; Frank et al. 2008), and by reinforcing the gender labeling of scientific and mathematical activities.42 While more universal secondary school requirements may strike some as antidemocratic, this concern must be balanced against the possibility that girls’ and boys’ seemingly free choices are constrained by taken-for-granted assumptions about what they will like and what they are good at and by the social sanctions that they may anticipate should they elect to pursue gender-atypical educational and career paths.
The effects of forced choice for women are worth studying.
And they discuss, but reject, segregated schools on what seems to be aversion to the reasons given by many proponents of it. "We oppose X because we think Y is false, and people who think Y is true favour X".
Enrollment in single-sex secondary schools or classrooms has been suggested as one means of reducing the salience of gender and the frequency of gender performances during the formative adolescent years (Thompson 2003). Although some beneficial psychological and pedagogic effects have been documented (Lee and Marks 1990; Shapka and Keating 2003), any large-scale initiative toward single-sex education would undoubtedly bring a host of unintended consequences (e.g., Datnow, Hubbard, and Conchas 2001). More important, we note that the philosophical rationale for single-sex educational policy initiatives is often based upon those very same gender-essentialist presumptions that have helped give rise to the segregation of scientific and technical fields in the first place (Hoff Sommers 2000; Gurian 2002). Intentional sex segregation of public schools or high school mathematics classes strikes us as an unrealistic policy option.
Thus, sociologists, again, are not blind: they
Citation
In academic work, please cite this essay as:
Ricón, José Luis, “Women in STEM: a cross-country view”, Nintil (2017-08-24), available at https://nintil.com/women-in-stem-a-cross-country-view/.
Comments