The Soviet Union: The Food consumption puzzle
[Part of the Soviet Union series]
In this post, I cover food and nutrition in the Soviet Union. What were the Soviets eating?
... It's complicated
(I) The Paradox
I begin with one chart:
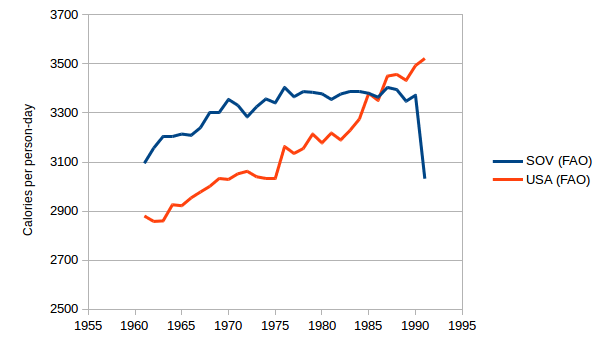
(This post deals with the post-1960 period)
So the Soviets were seemingly eating more calories than the Americans right almost until the end of the Soviet Union. Given that some people thought of the Soviet Union as a place stricken with famines and widespread queuing, this may look surprising. (Actually, the last famine in the SU happeend in 1947)
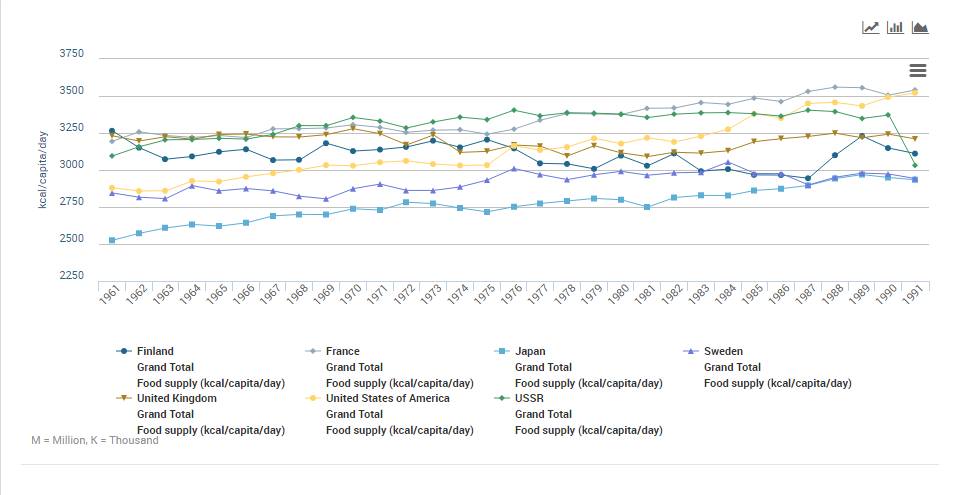
Here there are other countries, including Finland (so high Soviet intake was not due (just) to a colder environment) and Japan (Because you can have lower caloric intake and do fine too!)
But is the FAO data right? I did two things to try to see if it is. First, I checked the methodology they were using. Second, I compared with other data.
The FAO data comes from the Food Balances, and represents the food supply: production plus imports minus exports, plus stocks from the previous year. This contrasts with household surveys, in which people are asked how much are they actually eating. In turn, the data comes from official statistics.
In my second chart, I gathered many different sources.
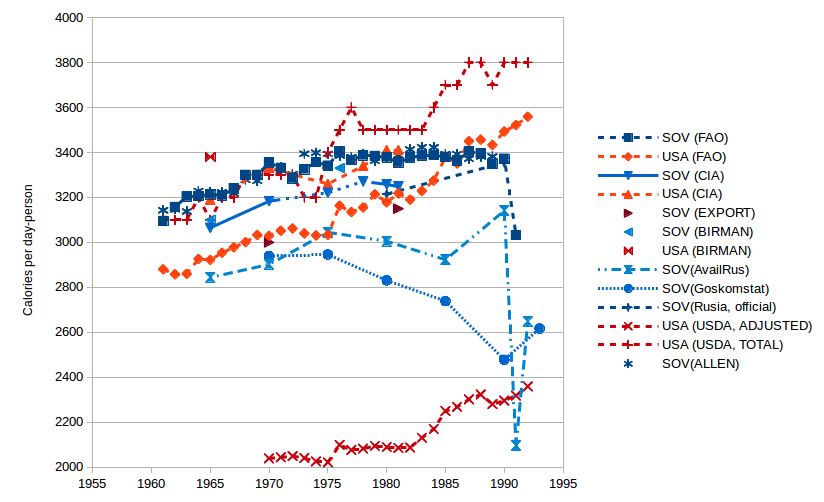
'My name is Ozymandias, chart of charts: Look on my works, ye Mighty, and despair!'
This is certainly despairworthy. There is a huge spread in the data. Below I explain where each data series comes from. FAO data comes from, well, FAO's food balances.
- CIA data comes from a report from 1984, released in 1999. The Nutrient Content of the Soviet Food Supply. Like FAO's, these figures are for food supply, not ingestion, which is lower because of losses. The report says that the nutrient content of Soviet food supply matches the US's. Carbohydrate intake is higher, and fat intake is lower, but gaps were narrowing. The CIA analysts also estimate that losses from production to consumption are higher than in the US. They also indicate that the high caloric consumption are problematic from a public health perspective. Food availability differed between regions in the SU. For example, fruit consumption per capita in the Russian SFSR was 40 kg per person, while the Siberian region just consumed 12 kg. Meat consumption in Estonia was 80 kg, but just 31 kg in Uzbekistan. (Data for 1975-1981)
- EXPORT data comes from a report written in 1986, Soviet Foreign Trade in Foodstuffs: A measure, by Vladimir G. Treml, written for the US Bureau of the Census. Among other things, he notes the enormous increase in food imports (especially grain) that happened between 1970 and 1981. According to him, the FAO figures published then (3400 cal per day for 1975-77) overstated actual intake mainly due to wrongly calculating the nutritional composition of Soviet foodstuff (Compared to official Soviet data). CIA data he references is higher than official Soviet data, but lower than FAO's. He discusses some funny incidents, like Novosti, the Soviet news agency, reported daily caloric consumption in the SU by giving the CIA figure from 1980. Treml rejects FAO data as too high, and gives a range of estimates for 1970 (2900-3100) and 1981 (3000-3300). He also says that both Soviets and Western analysts are probably overestimating Soviet nutrient quality.
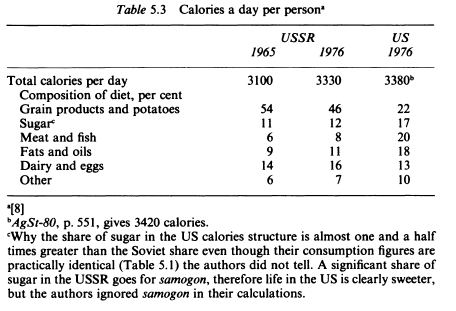
- BIRMAN comes from Igor Birman's book Personal consumption in the USSR and the USA (1981). I'll explain later why Birman deserves a place here. He says caloric consumption in the SU is a little less than in the US, even though it should be higher due to a younger population that performs more extenous work in a colder environment. Birman gives a figure of 3330 for 1976 (vs 3380 in the US). His data comes from Narodnoye khozyaystvo SSR v 19-9odu: statisticheskiy yezhegodnik(a yearbook published by the Soviet Union.)
- AvailRus comes from Nutritional Risk Factors in the Former Soviet Union, a chapter in a book by the US's National Research Council. They reference data from a consumer survey made by Goskomstat, the official statistics agency in the SU that (according to the authors) had the problem of not using a representative sample (Not that it was small, they covered 49.000 people).
- The Goskomstat item is food balance data from official Soviet sources, also from the previous sources.
- Russia (official) refers to official statistics of food consumption in kg coming from this book that references Torgovlya SSSR (another statistics yearbook), and converted to calories used coefficients developed by the US Dept. of Agriculture
- USDA adjusted and unadjusted is data from the US department of agriculture. Unadjusted can be read as 'food supply', and adjusted is accounting for food losses, trying to reflect how much people are actually eating. See figure 2.1 here. You can get the series from USDA's website.
- ALLEN is data from Robert Allen's From Farm to Factory. He takes raw data from FAO and calculates his own data series, explicitly accounting for food losses. The end result is identical to official FAO data. He takes other researchers (Wheatcroft, Jasny)into consideration, so his estimate is meant to be an all-things-considered one.
The problem with this is that sources who are trying to do the same (USDA and FAO) get different results. FAO's series looks like USDA unadjusted series. But FAO's series also look like Allen's, and Allen's are supposed to take losses into account. So someone is making a mistake somewhere. We could perhaps believe the official Soviet data rather than FAO's. But according to FAO, the Goskomstat surveys have two problems: one is that it oversamples lower income households, and that the coefficients used to convert food kg into calories are 15-20% lower than FAO's. They conclude that "with such large differences, it is difficult to say much about the level of caloric consumption with any confidence". And even if we took the official consumption data, that supposedly would be accounting for losses, it is still far from the similar figure for US intake from USDA, so differences in methodology must be present.
My conclusion is then that, based on the data above, Soviet caloric intake was high enough to say Soviet citizens were reasonably well fed, in terms of calories.
Here is how the picture changes when using different coefficients to convert kg of food into calories:

The lines trending down are official Goskomstat data, consistently lower than FAO's estimates.
(II) Broad strokes about the USSR
Consumption in the 1928-1955 era
A study saying Soviet citizens in the Republic of Karelia had C vitamin defficiency (And Finns living in the nearby North Karelia didn't).
Soviet utilisation of food (from the Soviet Interview Project). Apparently, even when the USSR was the world's largest milk producer, only 60% of this milk was consumed by humans (36% was fed to animals, and the remainder was wasted). This number was around 90% in the case of the US. 7% of it was converted into 'hard' cheese (24% in Europe). Official Soviet sources (mentioned in pp. 491-541) also confirm the high level of waste and inefficiency in the food supply chain.
The USSR was devoting 11% of its GDP to subsidise food consumpton.
From a dissertation (Hamm, 2012),
Dronin and Bellinger (2005, 310) point out, per capita consumption figures likely overstate actually available amounts, given that the Soviet Union’s inadequate transportation and storage infrastructure led to frequent shortages in stores, as well as significant loss of foodstuffs and raw products due to spoilage. Incidentally, this problem persists to the present day: according to recent estimates, equipment and infrastructure deficiencies cause Russia an annual loss of 15–20 million tons on grain, 1 million tons of meat, and 7 million tons of milk (“Russia’s Machines Cost 20 Million Tons of Grain, Institute Says”, by Marina Sysoyeva. Bloomberg, October 13, 2011).
Dronin and Bellinger (2005), for example, questioned the reliability of Soviet food consumption statistics after having discovered a discrepancy between the increases in per capita consumption reported in official government data, and the widespread mentioning of food shortages and rationing by the local Soviet press.
Both foreign observers and the Soviet press repeatedly noted the discrepancies between official production statistics and actual availability of food in stores. In 1988, at the height of perestroika, it was revealed that Soviet authorities had been inflating meat consumption statistics; it moreover transpired that there existed considerable inequalities in meat consumption, with the intake of the poorest socioeconomic strata actually declining by over 30 percent since 1970 (Dronin and Bellinger 2005).
Throughout the Soviet era, various and seemingly persistent problems had emerged to plague the country’s food system. Government experts estimated that the elimination of waste and spoilage in the production, storage, and distribution of food could have increased the availability of grain by 25 percent, of fruits and vegetables by 40 percent, and of meat products by 15 percent (Library of Congress 1991). Moreover, as Gray (Gray 1990, 94) estimated, “only 60 percent of the protein in Soviet milk [was] consumed by humans, and the milk that [was] fed to animals or simply wasted [had] more protein than half the meat Soviet citizens [consumed].”
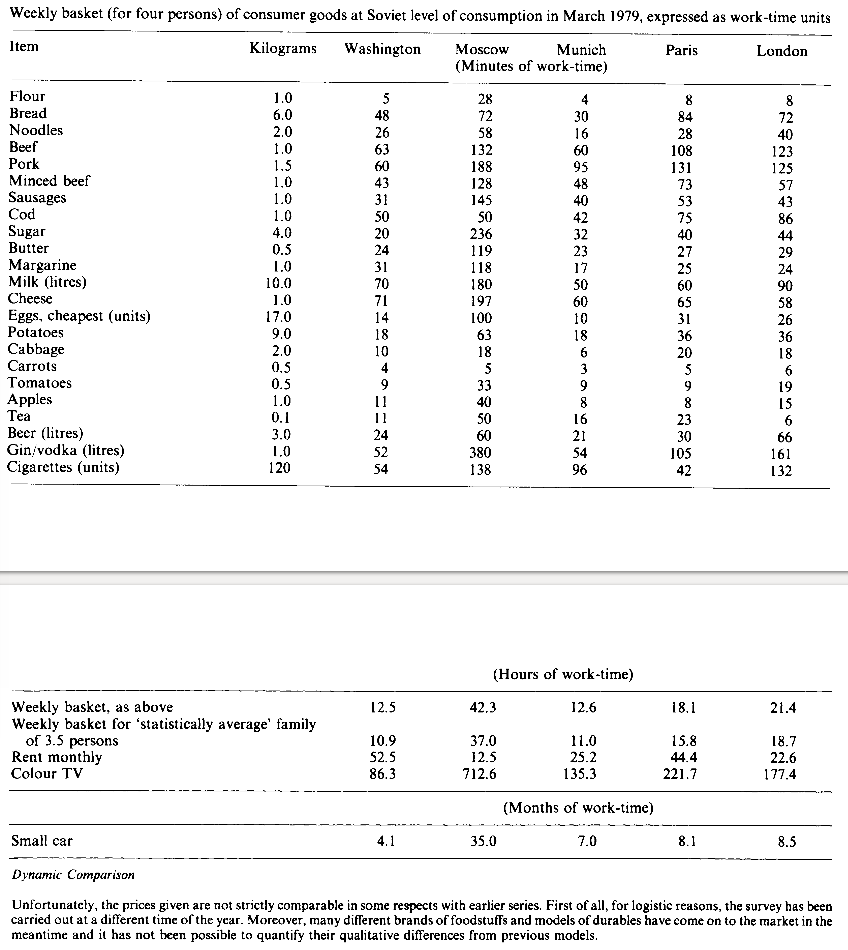
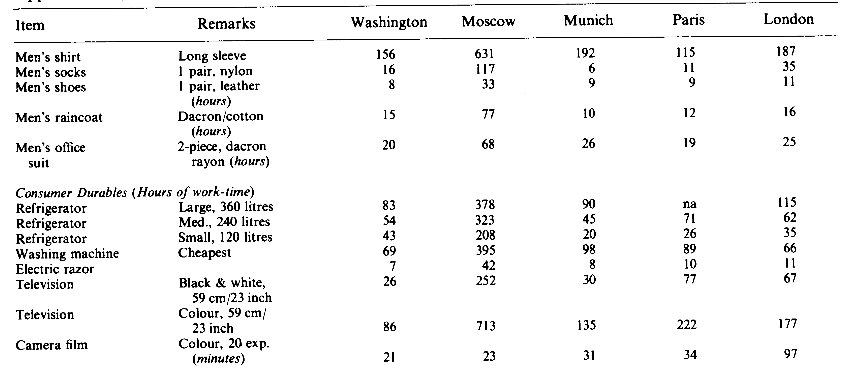
Prices, in minutes of work, for several goods in the USSR and other countries, from Schapiro, L., & Godson, J. (1981). The Soviet worker: illusions and realities. Everything was cheaper in the West, except for rent.
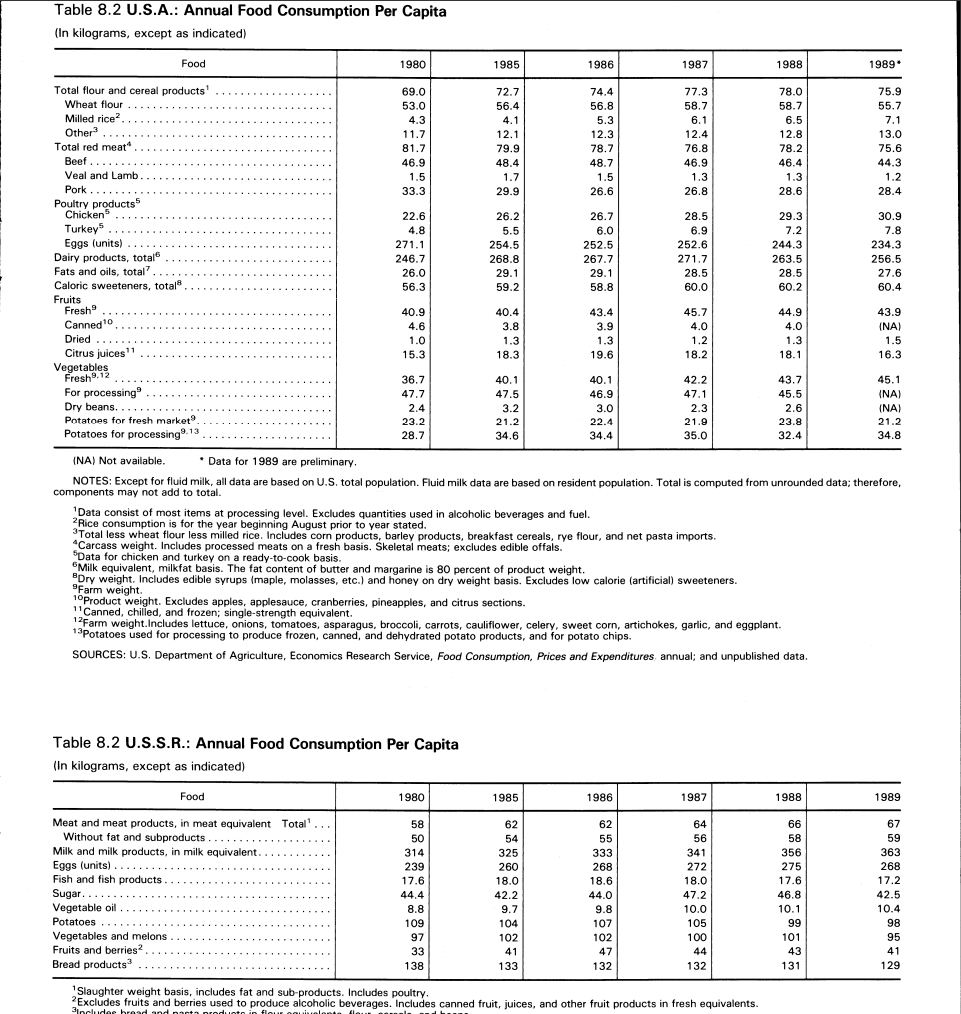
Data of consumption, in kilograms, by foodstuff, from the USA/USSR facts and figures.
Another factor that adds to the difficulties of comparing the USSR with the US is that the quality and variety of the goods was inferior. Gertrude Schroeder, a CIA analyst who spent months in different Russian cities reports that the quality of life and goods was worse than she had estimated from reading the literature. Queuing was prevalent when she reported, in 1968. By 1989, they were even more prevalent. (Gray, 1989 pp. 19-25 ). Apparently, they had began around 1965 due to increased consumption and subsidised food prices.
There is a whole literature (MacEachin, D. J. (1996), Ellman (2002), Wilhelm (2003)) dealing with the fact that the CIA consistently overestimated Soviet's quality of life, and the health of the economic system in general. We should then be careful with old CIA reports, and give more weight to more recent assessments of the data.
(III) Estimates of Soviet nutrition
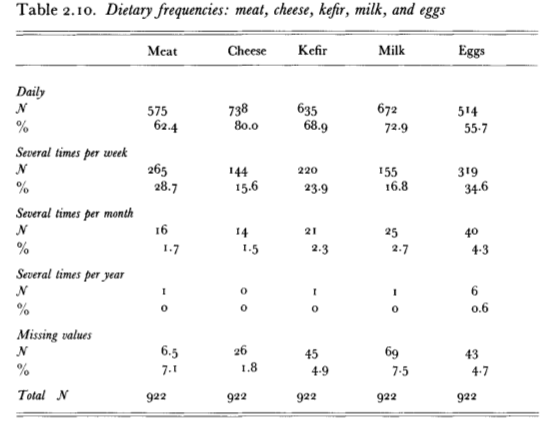
The first one is James R. Millar's Politics, work, and daily life in the USSR (1987), built from the Soviet Interview Project's interviews (N=922). Asking lots of people what they were actually experiencing is a good alternative to official statistics. What did they find?
Citizens reported daily queuing, inferior quality goods, and lack of supply sometimes. Most respondents said that there were deficits in meat supply. However, almost everyone had meat (and cheese, kefir, milk, and eggs) several times per week, and the majority had them daily. One explanation of why there was queuing and shortages while at the same time they were eating meat almost daily is that there existed a legal private market (rynok)
The prevailing system of food distribution is clearly a major source of dissatisfaction for essentially all income classes, even the best off and even the most privileged of these.
This doesn't tell us anything about the quality of these goods: Schroeder, the CIA analyst reported that Soviet meat, or lettuces weren't as good as Western's.
An additional problem of this survey is that
The SIP sample obviously was not a random, probability sample of the general population of the Soviet Union. In addition, our respondents voted with their feet and have faced the trauma of relocation in the United States. Any bias raises a question about the reliability and generalizability of survey results.[...] The frequency distributions presented in sections 6 through 9 of The Soviet Interview Project General Survey Codebook cannot be taken as estimates of the frequency distributions that would be obtained from a probability sample of Soviet citizens. Simple-minded attempts to use the distributions in such a manner will be likely to yield misleading results.
From Philip Hanson's The Rise and Fall of the Soviet Union (2003),
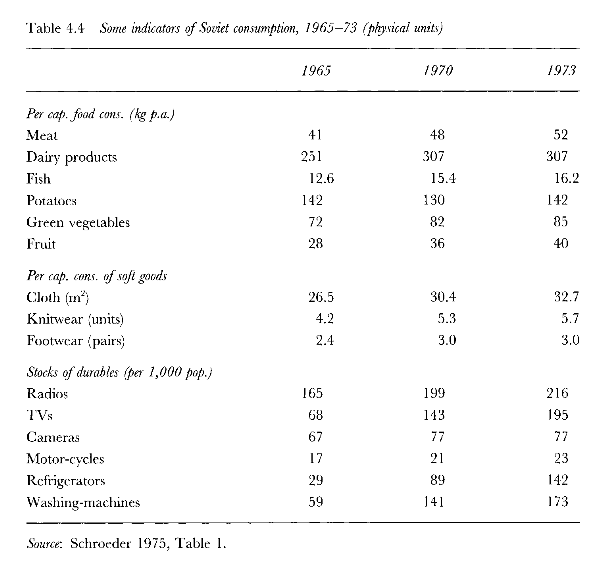
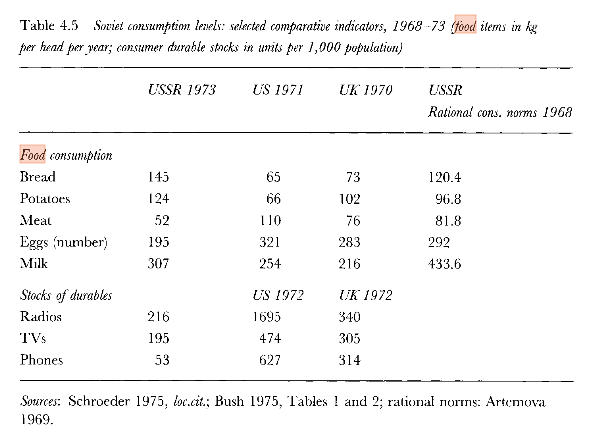
Overall, consumption as estimated by Schroeder and Denton increased at 5.2 per cent a year between 1964 and 1973, or 3.9 per cent per annum per head of population (op. cit., Tables A-1 and A-2). It was not, by West European or North American standards, a time of plenty, but it was unquestionably a time of real improvement. Schroeder (1975) provides per capita indicators as shown in Table 4.4. These improvements left the average Soviet household well ahead of people in really poor countries but still substantially behind people in the rich world. Soviet consumers were also consuming less than their own planners officially considered to be required by the 'rational consumption norms' they had devised.
The comparatively low quality of the Soviet diet, with its heavy reliance on bread and potatoes, is clear from Table 4.5. The exception is the comparatively high figure for milk (in fact, milk and dairy products), but this is slightly misleading. Fresh milk remained scarce in the cities, and a very large proportion of milk output was turned into the ubiquitous, and not unpleasant, Soviet cheese: almost certainly a larger proportion than people would have freely chosen had processing, refrigeration and distribution been more advanced.
[...]
Soviet citizens, despite the general improvement in consumption levels, had to cope with pervasive inefficiency in the production and distribution of food and manufactured consumer goods. There was at this time quite extensive discussion in the Soviet press of the problem of accumulating inventories of poor-quality or simply unwanted items (Schroeder 1975). This problem co-existed with shortages of many items: in other words, demand for those items exceeded supply at the controlled retail prices. Queues and black market deals were everyday experiences for Soviet citizens in the early 1970s, just as they had been ten or twenty years earlier. Food other than bread and potatoes tended to be defitsitnyi (deficit, or in short supply). The very vocabulary, defitsitnyi, with its opposite, nedefitsitnyi (not in short supply), suggests the scale of the problem.
Soviet cheese, in case you were wondering, refers to tvorogor quark cheese.
Finally, Igor Birman's Personal Consumption in the USSR and the USA (1989). Birman was born in Moscow in 1928, got a PhD in Economics, was Director of Planning in three factories, and in 1974 he emigrated to the US, where he worked as a consultant on the Soviet economy. He criticised CIA's estimates, and apparently he saw the downfall of the Soviet economy when everyone else were still saying that such thing was almost impossible (Wilhelm 2003). His analytical approach, so called anecdotical economics relied on facts, logic, and intuition (The Superforecaster approach?). In contrast, the CIA approach tended to trust more the official statistics, to which corrections were then applied.
Before taking seriously the results of calculations with models, we should first look at the data used. Unfortunately models are often much better than data. On the other hand, ideas and assertions should not be dismissed because they are not supported by models. Having lived in that country for 45 years, and having studied its economy from outside for another 11, I trust my intuition no less than models. I am not saying that all models are bad, or should not be used, but I suggest that reasoning, simple logic, and the like, which are called anecdotal economics must not be dismissed. [...]
Given what has happened and what we now know, Birman clearly did get it right. ….. some of the most 'advanced' techniques were used in studies of the Soviet economy….. But these techniques clearly did not perform as well as Birman's 'anecdotal economics' in getting the Soviet economic situation right. …..Yet if the process of scholarship is to avoid being a self-perpetuating and closed system of review and citation, which.. Birman encountered, there has to be a better arbiter than the refereed, scholarly journal. I would call it the reality test. (Wilhelm 2003)
Not only Birman seems a reliable source, he also wrote a book that devotes not one but three chapters to food.
What follows is taken from the book, and since Birman already wrote what is to be said, I happily copypaste from him:
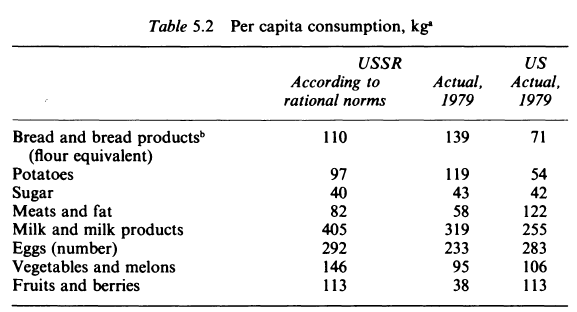
Rational norms here mean (unrealistic) recommendations from the Institute of Nutrition of the USSR.
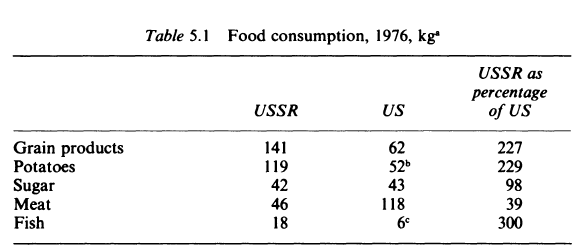
The key difference here, then, is that soviets were having more bread and potatoes, a lot less meat and fruits, and more fish than than in the US. The first table has a lower figure for meat, because it exludes meat 'subproducts' and fats.
I am not a dietitian, and it is hard to judge definitely, but apparently the average Soviet needs more calories. Many millions (several times more than in America) are still employed at heavy physicallabour, the climate is more vere, people walk more, expend a lot of energy standing in lines, riding in overcrowded public transportation with transfers and long waits; and the American population is older. Therefore, although more Americans engage in sports (see Chapter 10), overall the caloric content of food in the USSR should be higher. But, as we see, it is a little less.
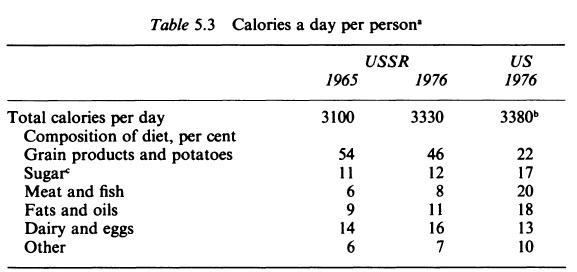
Table 5.4 is most important and we will return to its indicators many times. It reftects not only the quantity of food and its caloric content but other qualitative characteristics. The significance of the comparison in Table 5.4, and especially the figures in the last column, should be fully understandable only to those 'Iaymen' who read Chapter 2 carefully
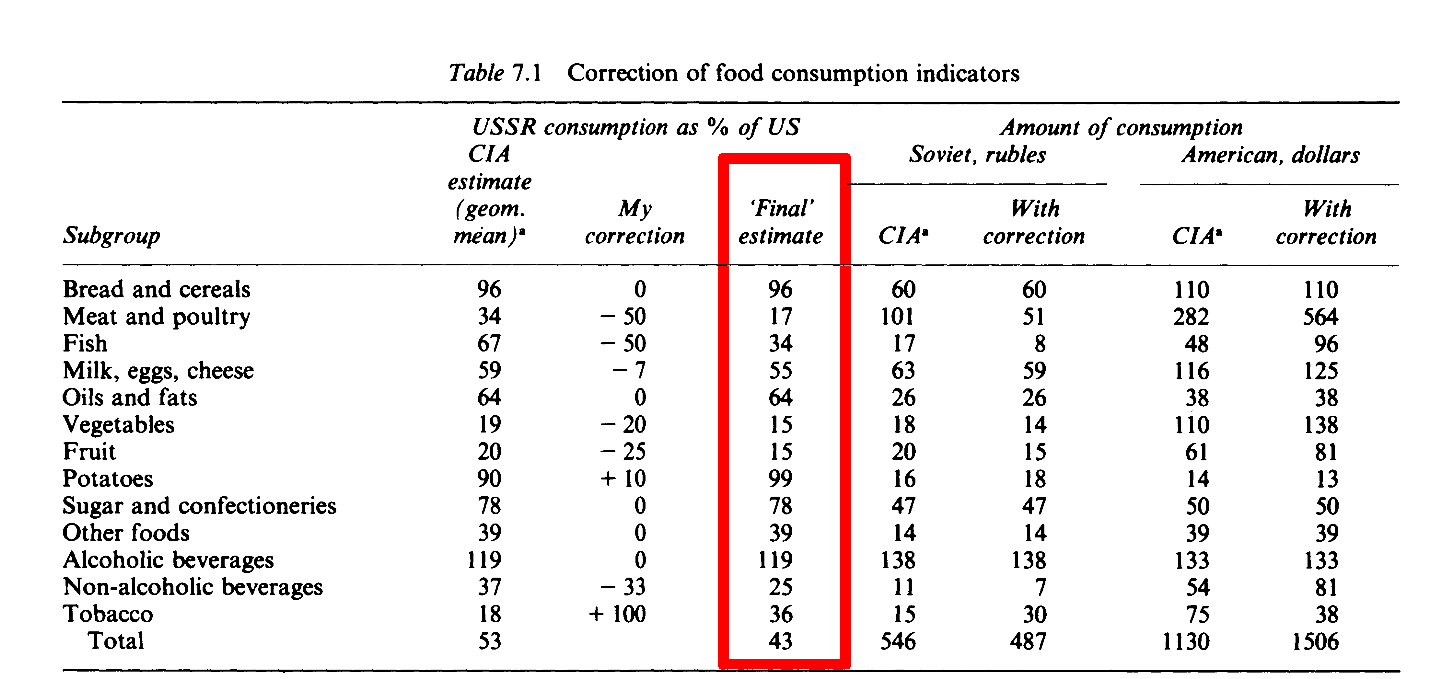
The main thing that follows from Table 5.4 is that in spite of the essential equality of the total amount of calories, the summary indicator of the total value of food consumption in the USSR is a bit less than half (49 per cent) of the USo The explanation lies in the differences of both structure of food consumption and product quality. With respect to quality, recall that the authors reduced the prices of American products in order to take differences into account. 4 Presumably precisely for this reason, for example, the volume of consumption of potatoes in the USSR was 90 per cent of American consumption although in terms of weight American consumption was less than half (Table 5.1). In the opinion of American manufacturers the quality of alm ost all American products is higher. The only exceptions were dried split peas, for which the Soviet product was judged equal in quality to the American, and sugar cubes, wh ich were rated better in quality than the American.
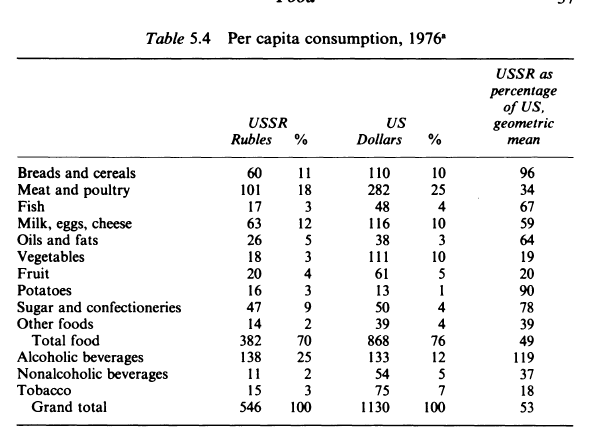
(The key number in Table 5.4 is the last column. It is made by converting the Soviet figure into dollars, and the US figure in rubles and comparing USSR-dollar and US-dollar, and USSR-ruble and US-ruble, and finally doing a geometric mean of the resulting comparison. Data for each item (how much the average person spent) was calculated to make it comparable. It is explained in Chapter 2 of Birman's book.
In the USSR, they are happy to have found some foods; they buy what the stores offer. Here, we buy what we want. There, food expenditures are a major part of family income; here, all including retirees and the unemployed eat weil. 1 1 In plant and institute cafeterias there, meatballs are made almost entirely out of bread, and ahorne dinner consists of soup, breaded patties, and a large amount of potatoes (or macaroni); here, dinner is a good cut of meat with some small garnish. There, only a few people have eaten lobster, pineapple, or avocado in their entire lives. The quantities of juices, spices and various imported products cannot even be compared. There, they eat tomatoes and fresh cucumbers from August through October, plums in September, and strawberries for two weeks at the beginning of summer; here, all these and much more is available year round. There, vegetables means cabbage, beets and carrots; here, there are dozens of types. There, apples are available in the fall; here, almost any fruit is eaten year round. The appearance of the very best Moscow (Leningrad) food store (gastronom) cannot be compared visually with an ordinary supermarket in some out-of-the-way place in America. There, the consumer carries his pickles horne wrapped in Pravda; American packaging is carefuIly planned for convenience of storage and use.
As a preliminary general remark I must say that the authors in their calculations, and in particular in establishing price ratios, clearly did not take sufficient account of differences in the quality of food, all the more so since perishable products were not shipped to America and the experts could not compare them. I will talk below about the huge waste ofpotatoes, other vegetables, and fruits; a significant portion ofthem is lost after purchase, potatoes are sometimes frost-bitten, vegetables sold unwashed and unsorted, fruits half spoiled. American milk does not get sour in weeks; Soviet milk is sometimes spoiled already in the store (and still sold). American meat cooks much faster. In the USSR frozen meat is considered bad; here the process of freezing products has achieved a high degree of perfection. Practically all American food is enriched with vitamins, while in the USSR in 1974 only 15 per cent of bread and bakery products were enriched.
FinaIly, the American food ration includes numerous products that have never been available in the USSR - countless spices, exotic fruits and vegetables, and those that are not so exotic for Western countries, and food ofvarious ethnic groups (Chinese and other Oriental, Italian, Mexican, etc.).
Incomparability of the quality of bread greatly complicates the comparison. In the unanimous opinion of all Soviet emigrants and many other Europeans, the quality of bread in America is worse.
However, first, in Moscow, Leningrad, and other major centres it is significantly better than in provincial cities. Second, bread of 'European quality' can always be bought in American supermarkets; regardless of the foreigners' opinions, we eat the bread that we like. Third, in 1974 only 6 per cent of bread and bakery products in the USSR were baked from flour of the 'highest class (vysshego sorta)
We come here to the crucial point ofmy entire overview. The poorer quality of Soviet meat is indisputable; such is also the opinion of the CIA economists. But how much worse? The problem is that the quality difference is difficult if not impossible to quantify; the estimate of the difference is unavoidably subjective. Strictly speaking, my subjective opinion is no more valuable than the subjective opinion of the CIA economists. In this particular case I have some arguments to substantiate my sharp disagreement with the CIA, but still I am forced to resort to a rather arbitrary estimate. I must say most decidedly that I fully recognise that many of my estimates are debatable. Lacking sufficient material, I often avoid numerical estimates (for example, in regard to publications - Chapter 8). For the same reason, I also make my final calculations (Chapter 13) in the form of a range of estimates. In most of the cases, my estimates do not pretend to be precise; they are to show the direction and the scale ofmy corrections to the CIA's calculations.
Nevertheless, I believe that all the material presented in the overview is sufficient to substantiate my final conclusions. Returning to our concrete case with meat I will say that here we do have the possibility ofmaking a rough estimate. In the opinion ofmany emigrants the quality difference of Soviet and American meat can be likened to the difference between cheap and expensive meat in each of the two countries. In other words, average Soviet meat is as much worse than average American as cheap Soviet meat is worse than expensive. Roughly, expensive American meat costs twice as much as cheap (approximately the same correlation exists in the USSR), so we can deduce that the average quality of American meat is twice as good as the Soviel. To repeat, such a deduction and estimate are rough, but I think that this approach is right in principle and that'we hit near the mark. This is supported also by a well-known fact: even when meat is available in Soviet stores, it is much more expensive (one and a half or two times) in collective farm markets - here quality is higher.
In America the share ofbetter quality fish is unquestionably higher. This follows at least from the fact that in 1976, the catch of salmon in live weight was 625 g per capita (twice that of herring), and consumption of canned salmon (edible weight) was 200 g.28 In the USSR salmon is now a very rare and expensive delicacy. Total per capita consumption of canned fish in 1976 was 2 kg in the US and 32 kg in the USSR. The authors' erroneous estimate of fish consumption in kilograms and the fact that their list of sampie goods for the subgroup includes only three types of fish which are far from the most representative fresh catfish, frozen codfish and tuna - are at the root of what I consider to be the unquestionable overstatement of the comparative volume of Soviet consumption for the subgroup.
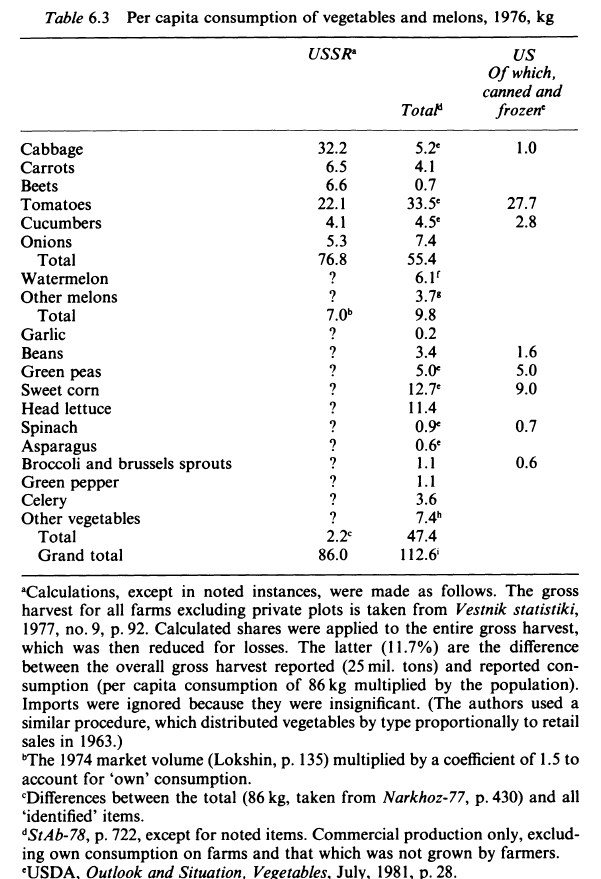
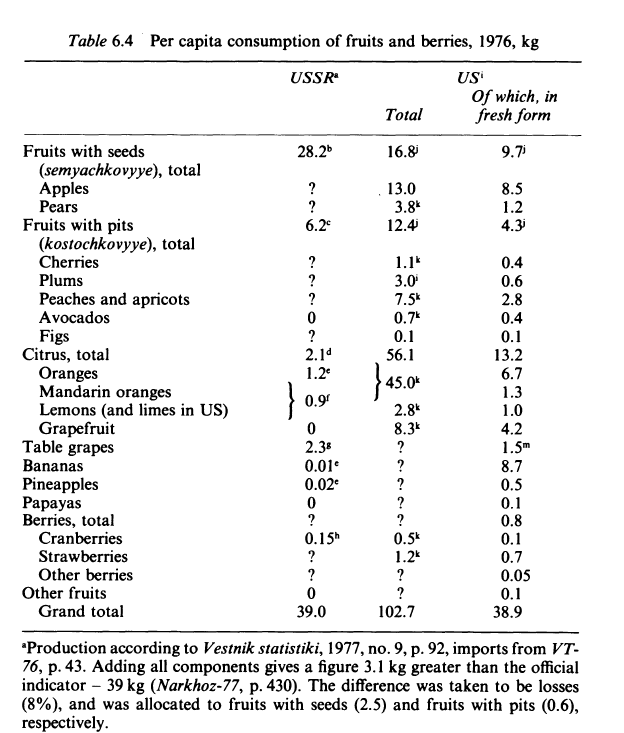
Table 6.3 presents some of my own calculations, and I must say immediately that far from everything in them is trustworthy. Regarding the data for the USSR, the point is not only that, because of the absence of other data, I distributed total consumption of vegetables by type proportionately to production on all types of farms excluding private plots. This is minor, all the more so since (according to official statistics!) only a little more than one-fourth oftotal production was on private plots. And the problem is not that, following Lokshin, I got an amazingly large amount of melons, but primarily that our totals are surely greatly overstated. The main thing, of course, is losses. If the reported per capitas consumption of vegetables (86 kg) is multiplied by the production and the resulting figure is subtracted from total production (25 m tons), we find losses to be only 11.7 per cent. But the Soviet literature is full of statements about significantly greater losses, which must at a minimum be two or three times greater. We should also not forget that losses are considered to be only that which was not sold to the consumer; when he brings them horne he throws away what is rotten and spoiled, which is not less than 10 per cent of the amount purchased (it is often mentioned in Soviet literature). In other words, in examining the figures for the USSR in Table 6.3, the reader should in no case believe his eyes; both the total amount of consumption, and consumption of individual of vegetables, are overstated at a minimum by about 20 per cent.
The reader may ask: why do I present questionable figures which even I do not trust very much? There are no better data (or I could not come by them). Still, they give a certain rough orientation. And, of course, just these (or approximately these) data were the basis for the authors' calculations
With respect to potaloes, we note first of all that while average Soviet consumption for the population as a whole was 119 kg urban per capita consumption was 90 and rural 164 kg. 60 This is further confirmation of the fact that less meat and milk products are eaten in the countryside than in the city. In this connection it is worth saying that in 1913 the Russian per capita consumption of potatoes was less than in 1976 - 114 kg, in spite of a much lower urban share of population (18 per cent compared with 61 per cent in 1976) - a fact that gives cause for wondering about dietary progress in this country.
Moving now directly to the results the authors got, we note that Soviet consumption amounted to (including sweet potatoes in the US) 218 per cent of American in kilograms (Table 5.1), and 90 per cent according to the geometrie mean (Table 5.4). Taking into account the markup in public dining (Table 5.5), we see that the quality of American potatoes was 2.2 times hetter than Soviet. That American potatoes are better is unquestionable. There are special varieties for boiling and baking. About 5 per cent of the total volume are sweet potatoes which are unknown in the USSR. The potatoes are carefully washed, sorted and packaged; frost-bitten potatoes are not sold (but there are very tasty specially-frozen potatoes). However, all this hardly leads to a difference of 2.2 times. Possibly (it is not stated anywhere) such a difference resulted from including in the subgroup various products from potatoes - in particular, potato chips.
We should not forget that potatoes are the mainstay of the Soviet diet. With the exception of people in southem regions, everyone eats potatoes every day and in large quantities. In America they are just one of many vegetables. Therefore, it could well be that the authors overestimated the difference in quality and thus underestimated the comparative volume of consumption for the subgroup. I would raise the comparative estimate of Soviet consumption by 10 per cent.
I must say most clearly that no great faith should be placed in this estimate. Once again I remind the reader that, while persistently criticising the CIA figures, I was forced to base my calculations largely on them; in particular, I did not determine price ratios and parities myself. Many things could not be checked because not all details are given in the CIA report. Moreover, the extent of my corrections is arbitrary: they should give no more than an impression of the direction and scale of the corrections needed. And, of course, my critique is far from over. As the reader will see in Chapter 12, there is still a whole series of comments that relate directly to calculations for food.
One of the first readers of the manuscript noted that my overall estimate does not very seriously change the CIA estimate, especially in rubles. If the present reader has formed the same opinion, it is mistaken. The point is not only that for individual subgroups the difference is great, but that, I repeat, not seeing many details, we may presume that there are other mistakes. At the same time I should repeat once again - in no way do I pretend that my corrections are precise. My purpose is to ascertain their direction and scale. For example, in reducing the authors' estimate for Soviet consumption of meat and meat products by 50 per cent, I cannot guarantee that in fact it could not be 40 or 60 per cent. However, I assert that, first the estimate must be reduced, and secondly, that the reduction must be very significant. In sum, considering the factors ofwhich we will speak in Chapter 12, the overall CIA estimate for the group must be substantially corrected.
Summarising, I will repeat my basic conclusion - the Soviet living standard, Soviet consumption, is less than American by at least a factor of 4.5. This conclusion can be used as a sort of rough estimate. 7 In no way do I want to, and indeed I cannot, idealise our American standard of living. I am not closing my eyes to much that is, so to speak, not too wonderful. New Y ork slums are horrible. I have seen beggars in New York and Washington and know that spending the night on a pile of old papers is not something Soviet journalists dreamed up. Though America has moved far ahead ofthe USSR, there are some houses that do not have telephones or even running water, air conditioners, or televisions. Far from every house that I have seen in visiting half of the states looks like a dream. In a remote valley of West Virginia, the television received only one channel. Not every good or service is necessarily of the highest quality. Trains run late. A snowfall paralyses life in the capital. Fresh fruits and vegetables in Europe (Western!) are tastier. Unemployment is certainly not a gift, just as finishing life on the meagre benefits for the poor is no present. The list of 'not too wonderful' things in America could easily be continued; instead I will say that pointing out each of them will only enhance the significance ofmy conclusions - that although some things may not be so good about the American standard of living, in spite of our shortcomings, life in the Soviet Union, the Soviet standard of living, is 4.5 times worse.
In spite of all this, the calculations demonstrate the overall scale of the Soviet lag. They unquestionably say that, even working with Soviet statistics, one should in no way think this lag will be overcome in, say, 20-30 years. At the very beginning I pronlised to present facts and figures and avoid epithets and exclamation marks. And here in this indeed emotional place I will try to give my final conclusion as quietly as possible. The Soviet citizens joked about Khruschev's promise to overtake and surpass America by 1980 and about the 'building of the foundation of communist society'. Some people were very serious about Andrei Amal'rik's prediction that the USSR will cease to exist by 1984. Not at all joking, if the USSR not only does not fall apart within the years to come and continues to exist in more or less the same form, even the youngest Soviets and even their children and grandchildren will not live to see the level of consumption achieved in America in 1976. Such is the sad but unavoidable conclusion of our entire analysis.
(III) A synthesis
So what should we think, then?
Were there queues everywhere in the Soviet Union?
Yes. There wasn't rationing, and people were able to go to supermarkets and buy what they wanted. But often, what they wanted wasn't available. The legal private market helped people obtain some of the missing goods.
Were Soviets hungry? Were there famines?
Not after 1947. Holodomor happened in 1932-33
Was Soviet caloric intake sufficiently high?
Yes
Was Soviet caloric intake higher than the US'?
No. In saying this, I'm saying the FAO is wrong, and that Robert Allen, who based his calculations in FAO data (and used their multipliers), didn't notice. To say this, I had to go through a full literature review, and I come to this opinion. Before reading my post, you were totally justified in believing that caloric intake was higher. Not anymore. Unless some FAO official tells us why did they used their coefficients, that seem to go against the Sovietological literature.
Was Soviet food quality worse than the American's?
In general, yes.
How does food consumption in the USSR compare to that of the US?
See Birman's Table 7.1 above. This estimate is adjusted for quality and quantity. Food consumption was lower than in the US in quality, and in many cases, in quantity. Overall, it was lower than in the US, except for alcoholic beverages.
How are you sure the FAO is wrong?
Their figure for calories comes from using wrong coefficients. Analysts referenced above pointed this out. FAO is aware of this, but they keep their coefficients without exactly saying why the official Soviet coefficients are wrong. Anyway, they themselves doubt you can get reliable estimates for Soviet data,
However, with such large differences, it is difficult to say much about the level of caloric consumption with any confidence.
How do you compare nutrition in two countries with different currencies, economic systems, preferences, climates, etc...?
Carefully. Igor Birman explains his methodology in chapter 2 of his book
Were there inequalities in food consumption?
Surely there were! Living in Moscow is not the same as living in Magnitogorsk, or being close to the Party is not the same as being a kolkhoz farmer. A future post will deal with the whole topic of Soviet inequality.
Shouldn't we trust the official Soviet data?
The CIA begins their analysis by taking the official data and correcting it. Birman then corrects CIA data. The Soviets themselves admitted that some of the data was fabricated, but you could take post-glasnost data as relatively accurate. As far as I know, no one has criticised Birman or the CIA's estimates for being too low. And if we go by official data, using the official coefficients, we don't get the FAO numbers, but the Goskomstat ones, so the final results will look better for the USSR if we compare them to the CIA's, but not good enough_to get FAO's._
Which of your references should I read to get a better idea?
Igor Birman's book, and the CIA report he references right at the beginning. If you find anything contradicting the broad picture presented here, please let me know.
How reliable is all of this? How much potatoes were Soviets actually eating?
Not much, and we don't really know! This is the best we can do with publicly available sources. That's the problem of having to deal with potentially fabricated data, having to compare different methodologies, and so on. But what is more reliable is the broad idea that if you were born in the West, you would be eating far better than in the Soviet Union.
Comments from WordPress
- “Trade-offs” em pesquisas econômicas: o caso do consumo de alimentos na ex-URSS | De Gustibus Non Est Disputandum 2016-05-14T11:49:35Z
[…] outro trade-off, por conta de um link enviado pelo Matizes Escondidos. Trata-se deste, sobre o puzzle do consumo de alimentos na (ex-)URSS. O trade-off, neste caso, é entre você sair correndo para estimar alguma coisa com a base de […]
- The Soviet Union: The Food consumption puzzle | Nintil – Noscibilis et Amabilis 2016-05-19T03:48:01Z
[…] Source: The Soviet Union: The Food consumption puzzle | Nintil […]
- Not all Soviet food is created equal. | Contravex: A blog by Pete Dushenski 2016-05-18T07:04:42Z
[…] Artir, some loveable Latin-loving bastard. […]
- Thursday assorted links - Marginal REVOLUTION 2016-05-12T16:24:31Z
[…] 5. What and how much were the Soviets eating? […]
- Three most interesting articles of the day (May 12) | BAIL: Bay Area International Link 2016-05-12T21:40:03Z
[…] Soviet Internet (Marginal Revolution). Unrelated: The Soviet Union: The food consumption puzzle […]
- Linky Linky... - Lawyers, Guns & Money : Lawyers, Guns & Money 2016-05-13T17:08:06Z
[…] A data-rich post on Soviet food consumption. […]
Tom 2016-05-13T20:05:21Z
Great post! Interesting to see how far the FAO's estimates could be. I previously knocked up a site to compare calorific intakes across countries (and for different foodgroups), and I must admit I I underestimated how far off they would be (reading through their methodology it seemed reasonable enough). It's only after reading this post the differences between the US & the USSR seem so stark.
Site's available here (apologies it's not a domain): http://108.61.175.65/world-food/
Artir 2016-05-13T20:36:23Z
Thanks for the comment! (And nice site!)
I checked how they made their coefficients, using models of how the human body transforms kg of certain foods into calories, and they do use different (slightly) coefficients for each country. But they don't have, as far as I know, explicit calculations of the ones used for the Soviet Union. Ideally, either some FAO official writes me a post telling me how wrong I am or they correct their website, but that won't probably happen...
- The Soviet Union series | Nintil 2016-05-14T15:57:05Z
[…] The Soviet Union: The food consumption puzzle […]
Julian 2017-04-25T23:57:14Z
Just another thing I thought of; the FAO's estimates of the Eastern Bloc's caloric intake as a whole during the Cold War is higher than that of Western Europe. I'm now wondering if the same caveats that you've pointed out here apply there as well (and this gets even weirder if you consider that (if I remember correctly) the FAO's figures for North and South Korea during the same period generally give the advantage to the latter).
They do give advantage to South Korea (http://www.fao.org/faostat/en/#compare), so here there would be no apparent paradox to explain, I think I'm not getting exactly what you are pointing to with your comment.
Mostly it's just making me wonder about the accuracy of the FAO data in general, given the apparent discrepancies in the USSR data.
Also, I remember this old article floating around the online Warsaw Pact a while back; I wonder what non-communists other than myself made of it?: https://web.archive.org/web/20070314063045/http://www.usm.maine.edu/eco/joe/works/Soviet.html
(Sorry for asking; I've been kind of on an Eastern Bloc binge for the past half-year, and I feel like I should take a break from directly researching it for a bit before I go mad).
I would tend to agree with that article from a quick perusal. The author agrees that it was inefficient, makes the point that climate should be taken into account (hm not sure about this one, some areas in Russia do have comparable climate to the US, I believe. This was in Allen's book), and that US agriculture is subsidised, which is true. But still the point remains
The thing with the Soviet Union is underperformance rather than failure (Unless you want to call that failure, given that their goal was to surpass the West). Equally, has North Korea failed? Well, there they are, with periodic famines and stunted development, but they have not imploded into a post-apocalyptic like setting.
Potato Man 2017-11-17T12:08:12Z
For the eastern bloc generally, the same thing can not be applied. The paradox here was between russian and fao coefficients.
Other countries dont have this paradox
- The Soviet Series: From farm to factory. Stalin’s Industrial Revolution | Nintil 2017-02-04T19:38:16Z
[…] Allen seems to rely on FAO data for his calories, something that I criticised here. But this doesn’t affect his argument, as my suggested adjustment would only drive the whole […]
Slightly off-topic, but has there been any new research that's compared prices in terms of work-time between the Eastern Bloc and the West since the fall of the USSR? I wonder how the chart you posted from "The Soviet worker: illusions and realities" would look now that economic information about the USSR isn't as much of a black box as it used to be (Also, how was that basket compiled? I'm wondering since it seemingly indicates that the average Russian purchased three times more beer than vodka, which seems weird to me).
Hello Julian,
As of the writing of my post, the cited papers were the latest available evidence (as far as I could find). The values in the basket are for a standard basket of foodstuff, amounts actually consumer varied. The higher price of vodka in Russia could be due to the fact that the Soviet state actively extracted revenues from it (Like it is done in the West for Tobacco)
Also, check tables 4.23 of https://www.census.gov/population/international/files/USSR.pdf . If you assume that most of the production was nationally consumed, and that populations were sort of equal, you do get that Americans consumed 10x the amount of distilled spirits compared to the USSR, and they conumed 10x the beer compared to the Americans. I didn't notice before!
Sorry, I wanted to say 'Wouldnt it be quite unrealistic that the USSR estimated themselves the lowest of these datas'.
Verano 2017-06-10T15:12:25Z
Y no tendrá que ver con que los países comunistas producían sobretodo carbohidratos(mucha mas calorías) y los países capitalistas tenían una producción mucho mas diversificada?
Los carbohidratos no tienen muchas más calorías (Depende del peso). 100gr de patata son 75 calorías. 100 gramos de filete de ternera son 187, por ejemplo.
Si, pero 100 gramos de ternera valen mucho mas que 100 gramos de patata ergo un país puede tener mas kilocalories produciendo masivamente patatas, otra cosa es que su alimentación sea adecuada.
Además, aparte del bloque del este, también hay otros países con kilocalorias "extrañamente altas" como puede ser Turquía, Egipto o Afganistan(década 60s) que están al nivel de países como Suecia o Japón y dudo mucho que el nivel de su alimentación sea similar...
Are you really sure that FAO hasnt calculated wasted into their estimate? Because, when I was reading an article about how their numbers were gathered, they said, they calculated waste in.
I'm interested in that article. But what I'm saying is not so much that they didn't factor in waste, but mostly that their conversion coefficients are upwardly biased. This is my resolution for the paradox.
a-i4046e.pdf
Thats the link. But one thing: I didnt really understand your criticism with the coefficients (I read the article multiple times). I mean, I understand, why theres a problem with russian and FAO coefficients, but who says that the FAO coefficients are wrong? And wouldnt make Allens statistic much more sence then?
Well, I do! We have these pieces of evidence: -Our priors about the whole thing -The estimates from various authors throughout the cold war -Goskomstat coefficients, which seem to fit with their estimates -FAO admitting FAO's estimates are dodgy, and that not much reliable can be said about the matter. Given what I present in the article, the most likely explanation to me is that FAO is wrong. Allen just took FAOS' data.
But how exactly is fao wrong? If I umderstand you right, you say that the official soviet documents and therefore coefficients are more trustworthy. But on the other hand, you say that they were fabricated. And you way fao is wrong because they didnt use the traditional soviet coefficients, but their own, by international UN standarts.
How does that fit together? And would you now claim that ALL fao data is wrong, as their official UN coefficients are not trustworthy? And were did you get the Goskomstat data? And wouldnt it be quite. Cause I dont think, that the soviets themselves would estimate their consumption the lowest.
Im not necessarily trying ro disprove you, I just want to understand whats on.
Rafael Trevisan Lisboa 2017-11-25T20:09:15Z
Where is the source for the "Calories per person-day" graph in USSR and US post 1960s? I can't find it is FAO's website.
http://www.fao.org/faostat/en/#data/FBS
Citation
In academic work, please cite this essay as:
Ricón, José Luis, “The Soviet Union: The Food consumption puzzle”, Nintil (2016-05-11), available at https://nintil.com/the-soviet-union-food/.
Comments