The paradox of Cuban GDP
The calculation of Cuban GDP is, surprisingly, a contentious issue. There are those who say that Cuba is one of the richest countries of Latin America, and there are those who say that the Cuban economy is mediocre. Who is right, and what causes this divergence?
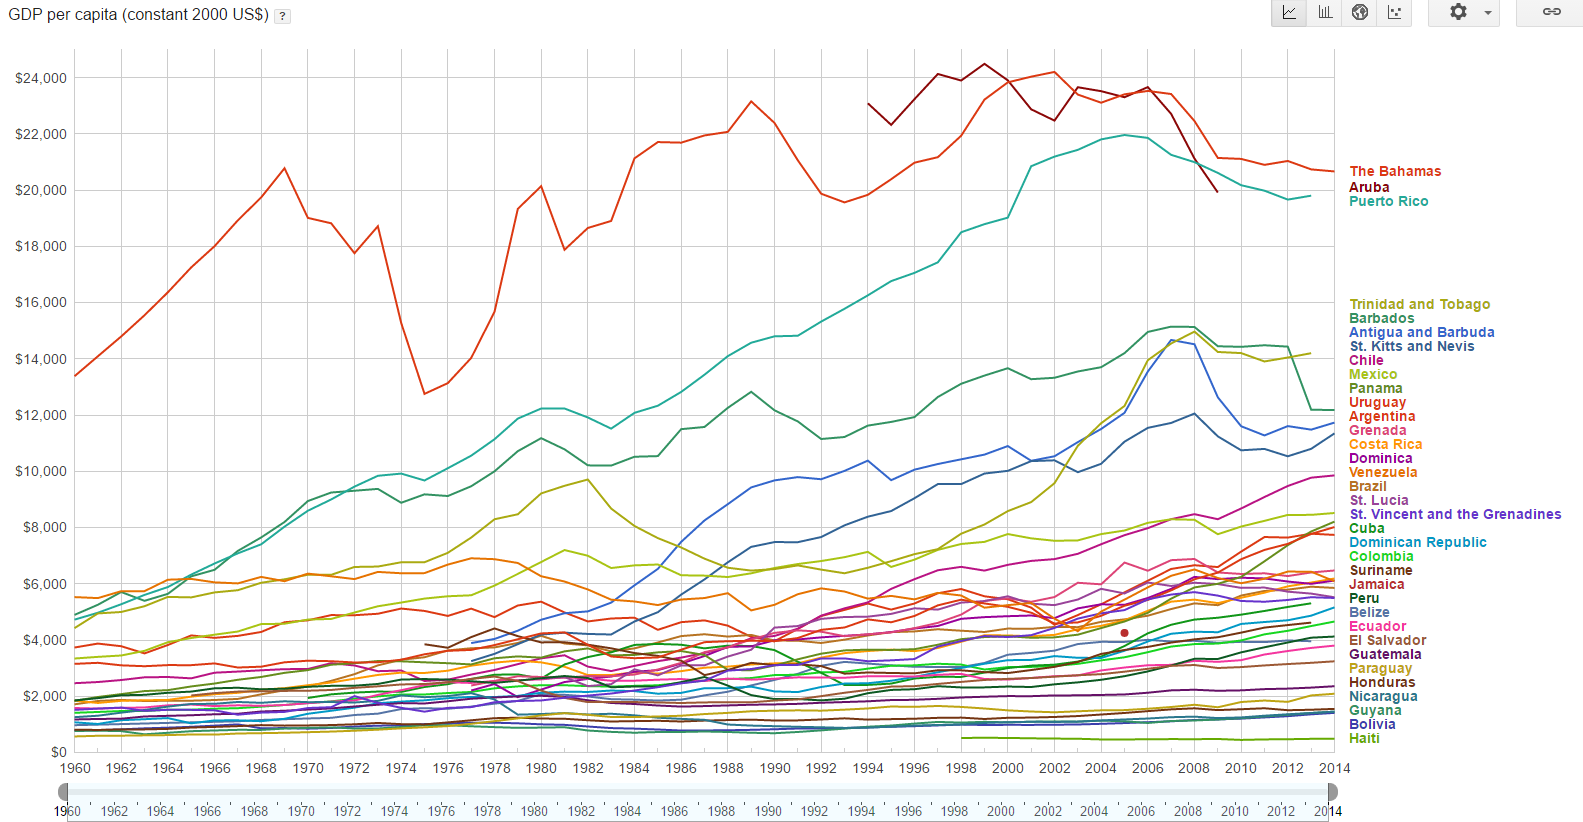
Let's look at Cuban GDP per capita according to the World Bank.
According to this measure, Cuba would have a GDP per capita in 2000 constant dollars of about 5400$. This places Cuba into the 'middle class' of Southamerica: below rich countries (Puerto Rico, Aruba, and Las Bahamas have 4x GDPpc), but above countries like Haiti, Bolivia, Nicaragua, Paraguay, Guatemala, Jamaica, or Colombia.
In order to be able to compare datapoints within a given timeseries for a given country, constant dollars GDP takes inflation into account. Now, to compare different countries, their GDP expressed in their national currencies is converted to a common currency: dollars.
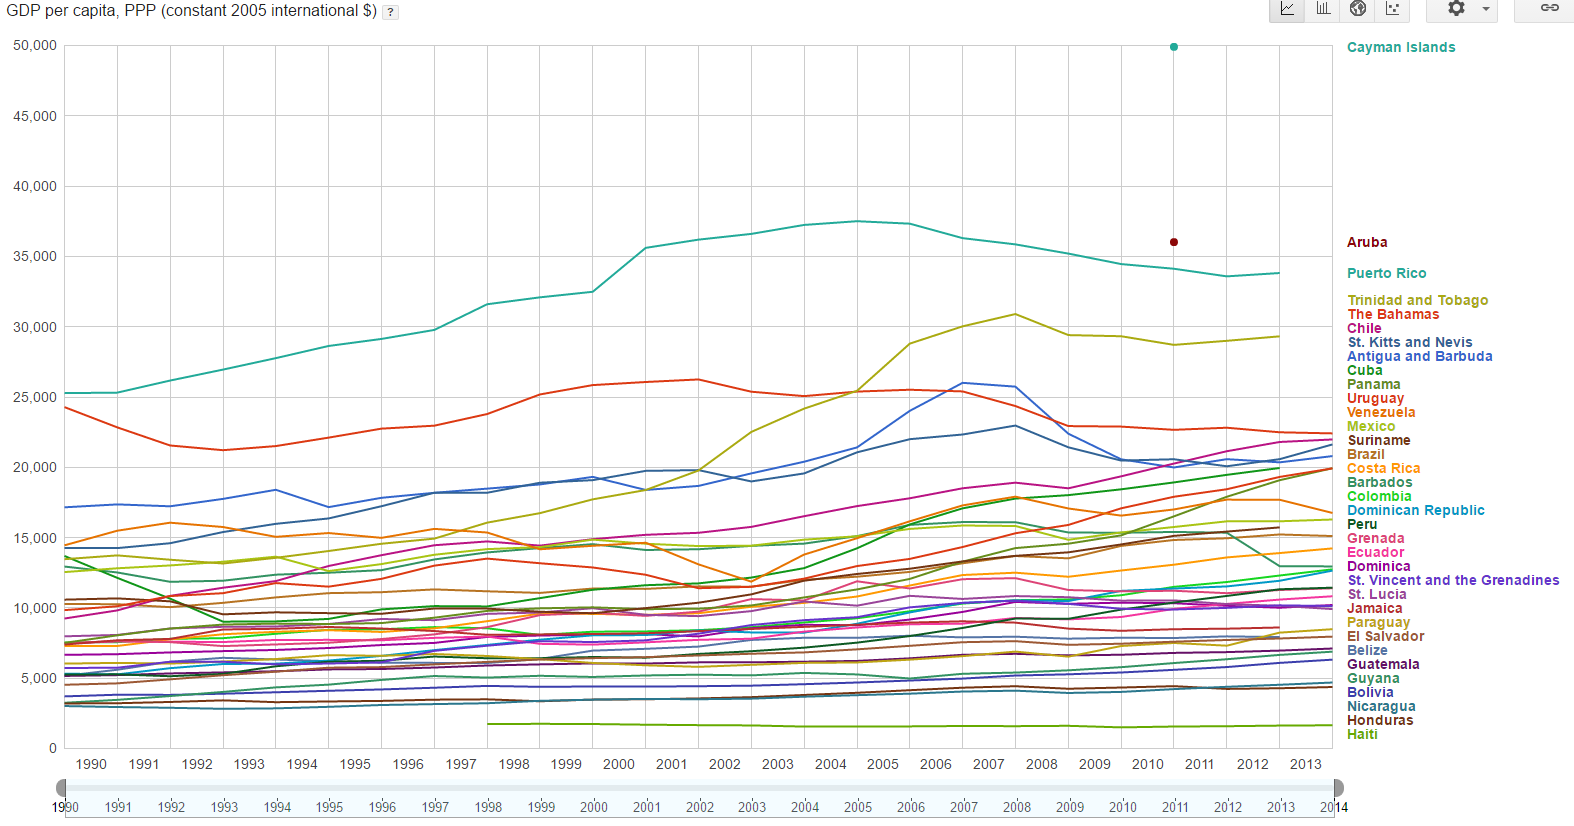
This, however, doesn't take into account the fact that prices in each country are different. That's why another correction is applied: adjusting for Purchasing Power Parity (PPP). World Bank also has PPP adjusted GDP per capita data.
According to this series of data, Cuba is now above many more countries, only bested by the Cayman Islands, Aruba, Trinidad y Tobago, Las Bahamas, Chile, St. Kitts y Nevis, and Antigua y Barbuda. Cuba would be the 9th richest country out of 37, something much more impressive.
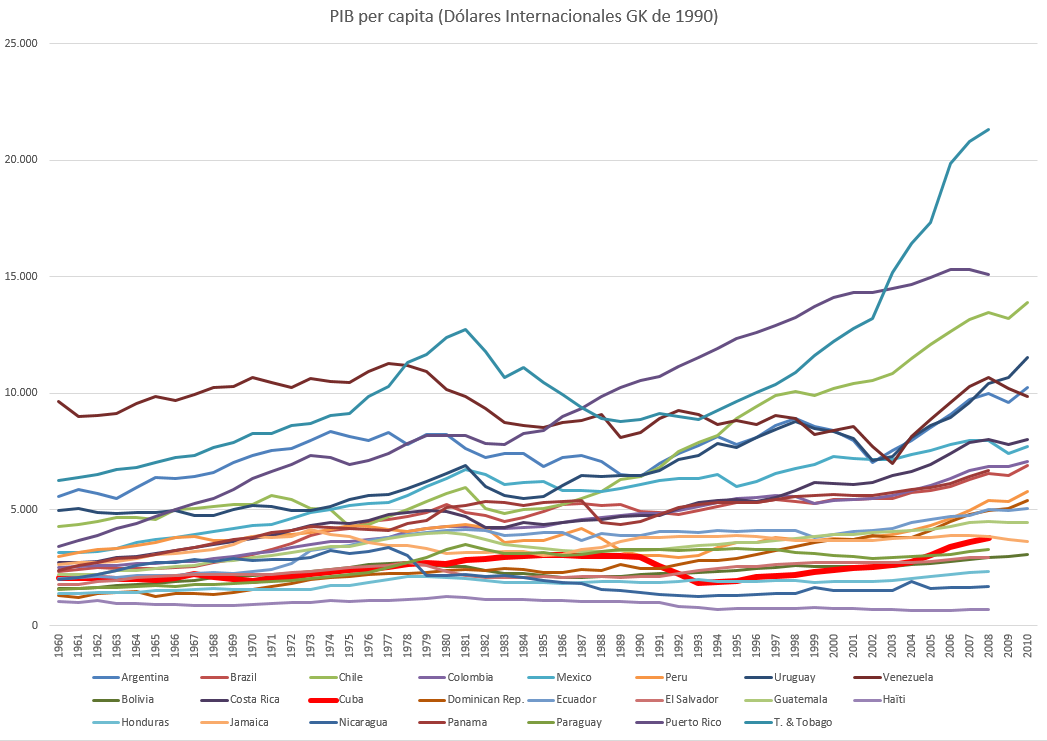
The paradox arises when one reads the Maddison Project GDP data, that tries to produce historically comparable GDP series for many different countries. Instead of PPP adjusted constant dollars, they use international (Geary-Khamis) constant dollars (1990), which is also PPP adjusted, but in a different way.
By this measure, Cuba is again a poor country within Latin America, both in an absolute and relative sense, compared to 1960.
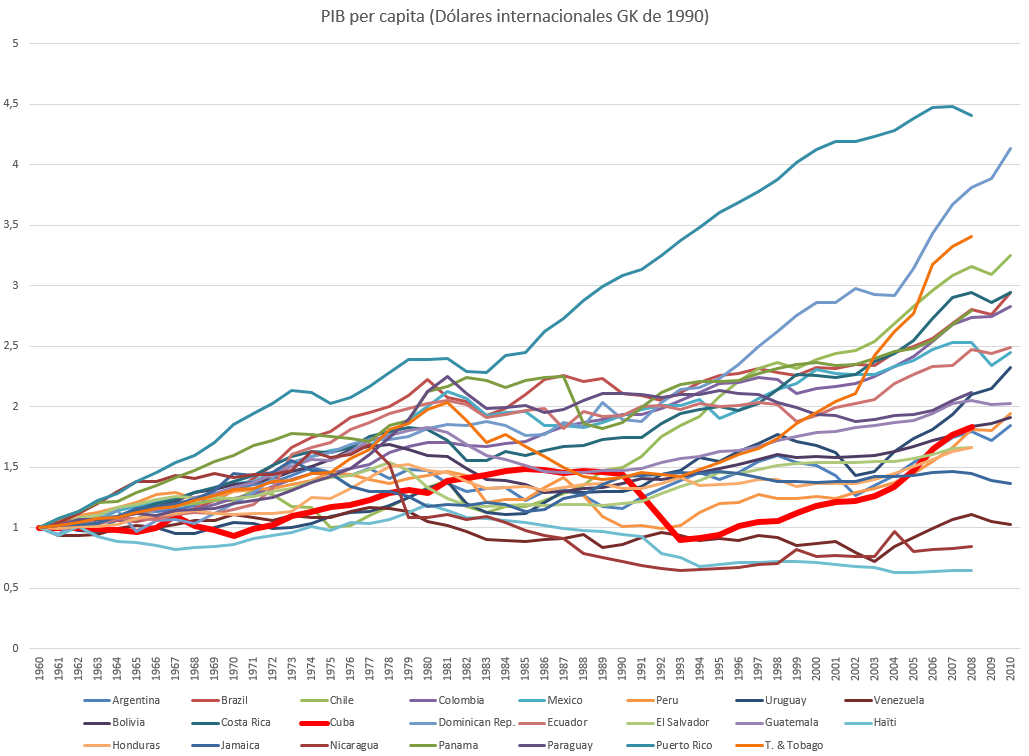
If we look at Cuba by periods:
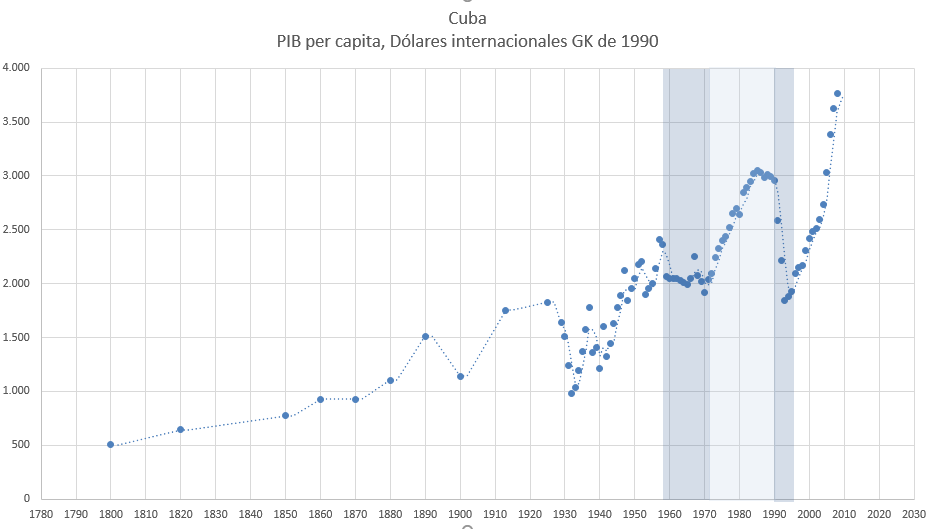
The first period (first blue rectangle) starts after the end of the Cuban Revolution, marked by stagnation in economic growth.
The second period starts with Cuba joining the Council for Mutual Economic Assistance (COMECON), an international cooperation organisation promoted by the USSR. Cuba received substantial subsidies from COMECON, including sugar purchases - Cuba's top export - at prices 11 times market prices. With Soviet help, Cuba experiences strong rates of growth.
The third period is the so called Special Period that started with the end of Soviet subsidies, which implied a need to readapt the economy. At the same time, the government implemented reforms that opened somewhat the economy to the outside, supporting tourism. These measures have some success, relaunching Cuba's economy.
So we now pose and solve our question: What is actually Cuba's GDP' Why do the World Bank and Maddison give different estimates?
According to Bolt & van Zanden (2013), in the methodological notes of Maddison's data, there are difficulties estimating what PPP index to apply to Cuba. They explain how they tried to overcome them. This is our first lead: that the issue lies in estimating PPP indices.
Cuba, 1800-1902, Santamaría, A. (2005), ‘Las cuentas nacionales de Cuba, 1690–2005’ Centro de Estudios Históricos, Centro Superior de Investigaciones Científicas (mimeo). The level for 1800 assumed to be identical to that for 1792. 1902-1958, Ward, M. and J. Devereux (2009), “The Road Not Taken: Pre-Revolutionary Cuban Living Standards in Comparative Perspective” (mimeo) 1958 onwards, Maddison, A. (2009), Statistics on World Population, GDP and Per Capita GDP, 1- 2006 AD, last update: March 2009, horizontal file http://www.ggdc.net/maddison/. An important caveat is that Maddison (2006) level for 1990 has not been accepted. The reason is that given the lack of PPPs for Cuba in 1990 Maddison (2006: 192) assumed its per capita GDP was 15 percent below the Latin American average. Since this is an arbitrary assumption, I started from Brundenius and Zimbalist’s (1989) estimate of Cuba’s GDP per head relative to six major Latin American countries (Argentina, Brazil, Chile, Colombia, Mexico, and Venezuela, LA6) in 1980 (provided in Astorga and Fitzgerald 1998) and applied this ratio to the average per capita income of LA6 in 1980 Geary-Khamis dollars to derive Cuba’s level in 1980. Then, following Maddison (1995: 166), I derived the level for 1990 with the growth rate of real per capita GDP at national prices over 1980-1990 and reflated the result with the US implicit GDP deflator to arrive to an estimate of per capita GDP in 1990 at 1990 Geary-Khamis dollars. Interestingly the position of Cuba relative to the US in 1929 and 1955 is very close to the one Ward and Devereux (2009) derived with a different approach. (Bolt & van Zanden 2013)
In turn, in another paper, Ward and Devereux (2012) apply a different method, the Ideal Fisher Index .
The Penn World Tables (the PWT) and Maddison (2007) value income with world prices calculated using the Geary Khamis procedure. In simple terms, Geary Khamis world prices are the expenditure-weighted average of national prices for all economies. We lack sufficient data to calculate Geary Khamis price indices for Cuba. For our bilateral comparison, the Fisher Ideal index has theoretical advantages over the Geary Khamis index. In particular, it is a “superlative index” and does not suffer from a substitution bias arising from using a fixed set of world prices see Diewert (1976), see also Neary (2004).
These two methods (Geary-Khamis dollars and the IFI) so far coincide in their results.
But then what does the World Bank do? The same thing that the Penn World Tables (PWT, another source for macroeconomic data) used to do: Use the price indices from the Interntional Comparison (price) Program from the World Bank. And it turns out that some authors who participated in the production of the PWT have criticised the 2005 version of the price indices, which is why Cuban GDP is not in the PWT anymore.
The World Bank has slowly realised that there is something wrong with Cuban GDP, and in the latest revision of their price indices, there isn't even an estimate of Cuban GDP, saying that
The official GDP of Cuba for reference year 2011 is 68,990.15 million in national currency. However, this number and its breakdown into main aggregates are not shown in the tables because of methodological comparability issues. Therefore, Cuba’s results are provided only for the PPP and price level index. In addition, Cuba’s figures are not included in the Latin America and world totals.
If the economistS in charge of PWT, and the ones at WB doubt their own estimates for PPP adjusted Cuban GDP, it is hard to take them as valid. Maddison's and Ward-Devereux's, on the other hand, do give similar results, which may indicate that they are closer to the truth.
Yet another source that we can use is UNDP, the UN agency that produces the Human Development Indices. In a 2010 report, they also express doubts regarding the calculation of Cuban GDP. But in their 2015 report, using a revised GDP, they do provide an estimate, and this times it is closer to the values of Maddison and W-D. Using this corrected GDP, by the way, their HDI falls to 0.759, and so Cuba drops from the second country with the highest HDI in Latin America to being the ninth.
The 2013 HDI value published in the 2014 Human Development Report was based on miscalculated GNI per capita in 2011 PPP dollars, as published in the World Bank (2014). A more realistic value, based on the model developed by HDRO and verified and accepted by Cuba’s National Statistics Office, is $7,222. The corresponding 2013 HDI value is 0.759 and the rank is 69th.
So finally, with the per capita GNP data (Not GDP, but this is not relevant) from UNDP (2011 dollars, PPP adjusted), Latin American countries can be ranked like this:
| Trinidad and Tobago | 26.090 | | Argentina | 22.050 | | Bahamas | 21.336 | | Chile | 21.290 | | Saint Kitts and Nevis | 20.805 | | Antigua and Barbuda | 20.070 | | Uruguay | 19.283 | | Panama | 18.192 | | Venezuela (Bolivarian Republic of) | 16.159 | | Mexico | 16.056 | | Brazil | 15.175 | | Costa Rica | 13.413 | | Barbados | 12.488 | | Colombia | 12.040 | | Dominican Republic | 11.883 | | Peru | 11.015 | | Grenada | 10.939 | | Ecuador | 10.605 | | Dominica | 9.994 | | Saint Vincent and the Grenadines | 9.937 | | Saint Lucia | 9.765 | | Paraguay | 7.643 | | Jamaica | 7.415 | | El Salvador | 7.349 | |
Cuba
7.301
| Guatemala | 6.929 |
| Guyana | 6.522 |
| Nicaragua | 4.457 |
| Honduras | 3.938 |
| Haiti | 1.669 |
Out of 30 countries, Cuba is the 25th, with Guatemala, Guayana, Nicaragua, Honduras y Haiti behind.
Out of 12 Caribbean islands, Cuba is the 11th, with only Haiti behind.
Conclusion
On the one hand, we have World Bank's estimate, that WB itself doubts. On the other hand, we have estimates from Ward-Devereux, Maddison, and UNCP. These three sources seem to approximately coincide on what the actual Cuba GDP is. This triple coincidence, versus the questionable values from WB, would make us choose the former values, and so accept thatCuba is a poor country within Latin America.
One critique to this would be to compare Cuba using other indicators: mortality, life expectancy, literacy rate, or malnutrition. This is also interesting, but not the point of this post.
The paradox of Cuban GDP is thus solved.
Comments from WordPress
- Ideology & Human Development | pseudoerasmus 2016-12-03T06:08:28Z
[…] post “The surprising human development index of Cuba” (also in Spanish); and “The Paradox of Cuban GDP” (also in […]
Latin American 2016-12-05T13:08:03Z
Weird to see Venezuela at the 9th position of the rank, as their economy is collapsing and they are literally weighing the money instead of counting it in markets https://www.bloomberg.com/news/articles/2016-10-31/tired-of-counting-piles-of-cash-venezuelans-start-weighing-them
Aaron Jordan 2016-11-30T19:16:00Z
Good piece, but I think Latin America is the term you are looking for.
Artir 2016-11-30T19:17:01Z
Thanks, fixed :)
Citation
In academic work, please cite this essay as:
Ricón, José Luis, “The paradox of Cuban GDP”, Nintil (2016-11-30), available at https://nintil.com/1-the-paradox-of-cuban-gdp/.
Comments