Wildfires in California (I)
Table of Contents
- How many acres burn every year? Is it getting worse?
- The role of climate change
- Why do the fires start?
- Plot time!
- Who is in charge where?
- Trends elsewhere. Is it getting worse in general?
- Fire suppression, fire exclusion and prescribed fire
- So is it fire exclusion or climate change?
- Conclusion
- Further questions
- Changelog
California has a habit of going up in flames on a yearly basis, leaving Cyberpunk-worthy scenes as a result. Why does this happen and where is it going is the topic of this post.
How many acres burn every year? Is it getting worse?
There is broad consensus in the scientific community that wildfire behavior is changing across the American West in general, and in California in particular. Figure 2.3 highlights trends in wildfire activity in California since 1990. All indicators shown—wildfire occurrence, total area burned, and average fire size—display an upward trend in the last several decades across the state (The Costs of Wildfire in California)
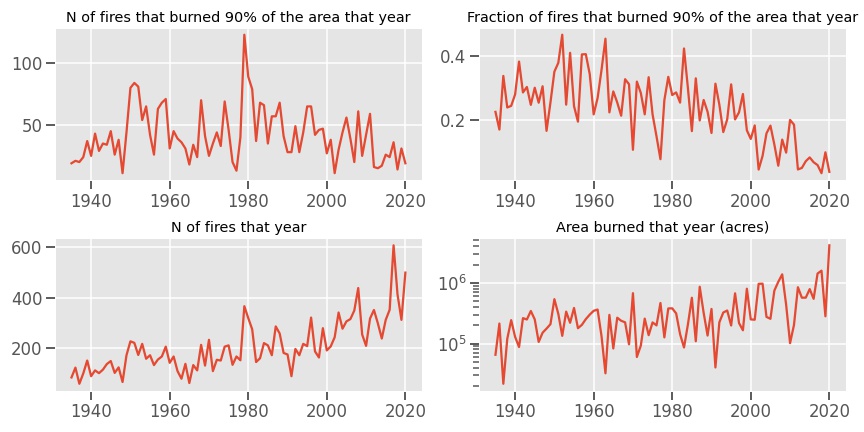
From the chart below, it seems clear that there is an increasing trend in burned yearly acreage. Taking for example the worst 5 years in the period covered by the graph (67) years, they all take place in fairly recent years. But we should also note another peculiarity, that in any given year it is far from certain that, even with an overall increasing trend, one would observe a particularly bad year.
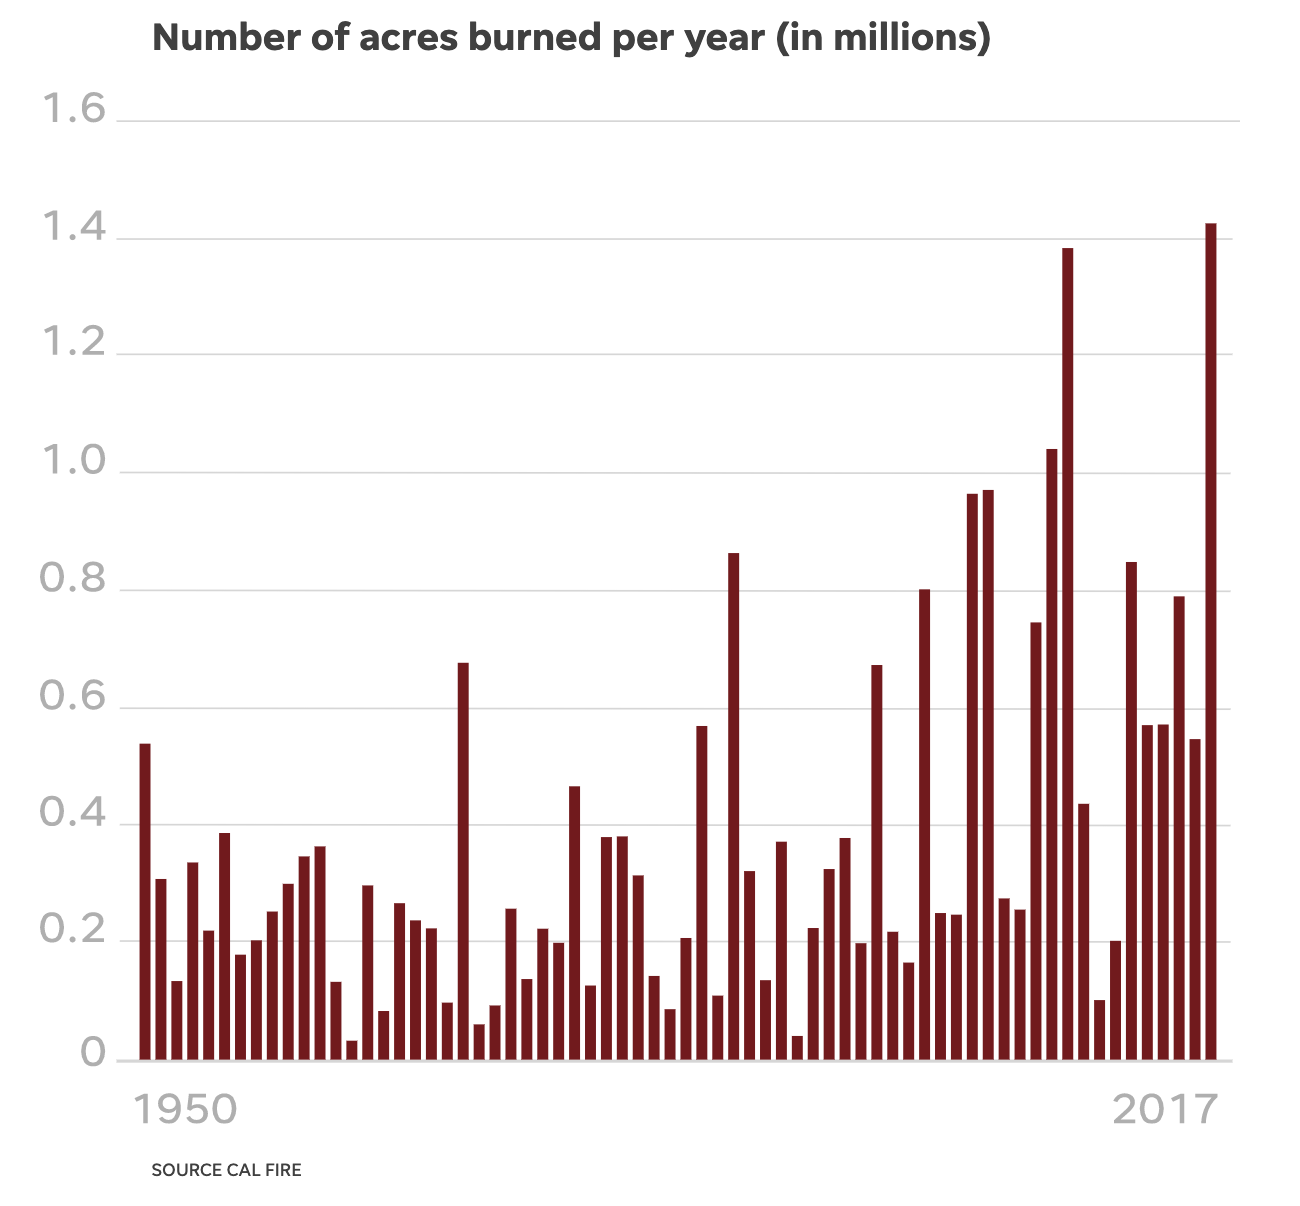
It didn't stop there, if we add the rest of the years until and including 2020, we get to the worst year ever. Note also that the distribution of fires per year is highly variable; there is an increasing number of fires and area burned per year, but this doesn't mean any given year is guaranteed to have many fires.
Is this data valid?
How do we know how many acres burn per year? There are various sources of data:
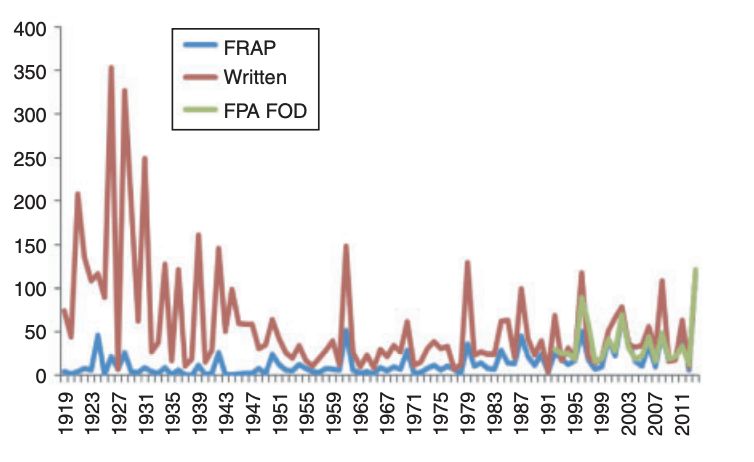
- There is satellite imagery taken regularly by the Landsat satellites and others. It's then a matter of comparing before/after pictures, drawing a polygon, and measuring its area. It doesn't seem to matter from which satellite the data comes from, the results are very similar (Edwards et al., 2018). The first Landsat satellite was launched in 1972, so prior to that we just don't have satellite data for fire.
- Then there's the written records from various fire agencies which go all the way to the 1900s. Some of these records use data derived from airborne cameras
- For even older data, area burned can be inferred from fire scarring in trees. This works up until ~1700, and beyond that the data gets noisier
- One can also sample the soil and measure charcoal accumulation. A paper I discuss later uses this method to go over a millennia into the past
This question has been raised within the literature regarding the reliability of the written records, the consensus is that they are trustworth (Keeley & Syphard 2018),
Most investigators are unfamiliar with these historical fire records and are sometimes sceptical of their accuracy. For example, Stephens (2005) contended that USFS data before 1940 were inaccurate, but cited a source (Mitchell 1947) that provided no evidence of this. Likely, the idea comes from Donoghue’s (1982b) comment ‘1940 marked the modern era of fire reporting’. However, that comment was in reference to the fact that ‘the report issued at this time was the first designed for automated data processing and easy readability’ and was not in reference to reliability. Historians have generally been confidant in these early California fire records (Brown 1945; Show 1945; Clar 1969; Cermak 2005). The first author, J. E. Keeley, examined all of the California fire-related materials stored at the state and federal archives and believes collectively they show managers have always been conscientious about reporting accuracy and completeness. For example, beginning in 1905, USFS recordkeeping required 15 items of information on the fire reporting Form 944, including the specific cause (Donoghue 1982b). On state-protected lands there was an incentive in that the 1911 Federal Weeks Law provided fiscal aid to states based on statistics of fire protection (see http://www.calfire.ca.gov/ about/about_calfire_history2, accessed 23 May 2018).
In 1919, the California state legislature appropriated money for fire prevention and suppression, and records in the state archive show that, by 1920, there were more than 400 fire wardens distributed throughout the state who were charged with firefighting and fire reporting. In 1920, there were 800 flights of the Army’s 9th Aero Squadron fire patrol that covered 426 500 km during the 5-month California fire season (Cermak 1991).
Fire scars - ground records
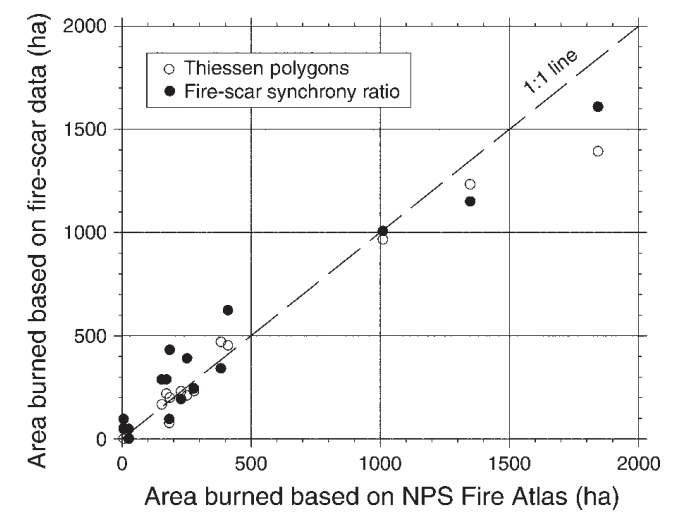
Regarding even older fire areas inferred from fire scarring, it's an imperfect metric for multiple reasons: trees may not have scars even if they burned, trees may all just die and not leave a trace of the fire, and the composition of a given forest may have changed: if one finds a handful of trees with fire scars, is that a small fire, or was that part of a larger fire but where the rest of the forest died? Then one is forced to turn to statistical techniques to correct for these factors. There are some studies that aim to measure how well looking at fire scars correlate with the written record for old fires (Fule et al., 2003). This is what the correlation for the written record and fire scar-derived data (by two different methods) looks like, showing reasonable agreement in one area studied over the period 1937-2000 (Farris et al., 2010; for a less optimistic view, Shapiro-Miller 2007, though here it seems to be a lack of good written records rather than fire-scars being wrong),
Satellite data - ground records
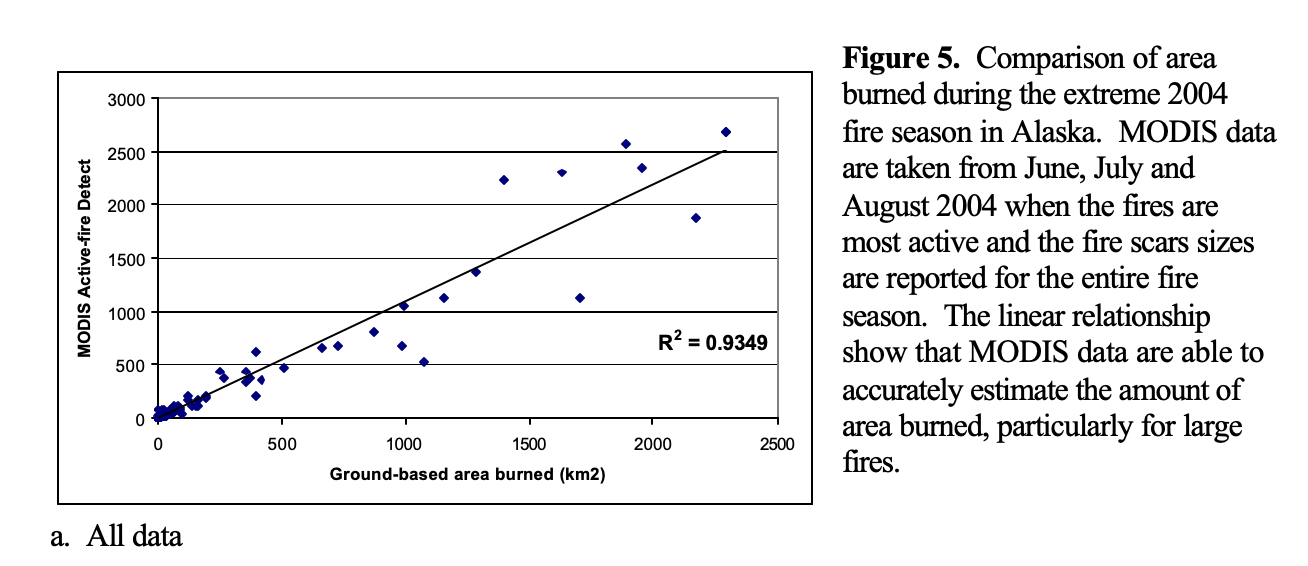
Satellite data matches ground-based data as well, although we can only see this for more recent data when we have satellite imagery (Soja et al., 2006).
Further into the past
There are some that argue that this is not because of climate change based on the extended record of yearly burned acreage. The plot above only goes back to 1950. The data they point to there is indeed real: The National Interagency Fire Center did say that fires were at its very worst back a century ago, getting better until perhaps all the way to 1996. In fact, even with the chart above, if one squinted at the 1950-1996 data, one might still conclude that it is trending down. The original source of the data caveats the figures with Prior to 1983, sources of these figures are not known, or cannot be confirmed, and were not derived from the current situation reporting process. As a result the figures prior to 1983 should not be compared to later data.
The same trend can be glanced in Figure 21 from Syphard & Keeley (2016), a review of various long-run wildfire data sources. The authors do not dispute the underlying data (i.e. they agree that there is no secular increasing trend).
This finding is surprising because it is often heard that climate change is leading to an increase in wildfires. But if there is no increase, then maybe climate change doesn't have much of an impact here? That is, are we living through a period with an unusually low amount of fire and what we're seeing now is a return to normal?
The role of climate change
This is a position held by some like Michael Shellenberger, see here, here, and especially here. He points to other factors driving the recent increase in fires, especially fire suppression, or rather fire exclusion: the practice (that I will discuss later) of not allowing any fire in the environment, which leads to the accumulation of fuels, and larger fires years later. Shellenberger has many things right but the overall message is wrong, there is enough evidence that climate change is a key player in the wildfire situation in California. More on this later.
Another factor others point to is a substantial increase in housing construction in the wildland-urban interface (WUI), which is mentioned by a scientist cited in the piece (Keeley) leading to more fires. More people living near wildland areas means also more roads (vehicles are a nontrivial source of ignitions), more powerlines, more campfires (easier to go camping when nature is close to home), and more accidents that can lead to fire in general.
Yet another factor that modulates the role of climate on wildfires (Keeley & Syphard, 2019), in the short term at least, is that higher rainfall in one year leads to more fires the next (more vegetation grows). Indeed the "wettest" year in California ever far (2016-2017) was followed by intense fires (2018).
And in turn these periods of higher or lower rainfall may be driven by natural oscillations in the climate (like the Pacific Decadal Oscillation or the related Atlantic Multidecadal oscillation). A paper from 2007, Kitzberger et al. noted that A current warming trend in AMO suggests that we may expect an increase in widespread, synchronous fires across the western U.S. in coming decades., which is precisely what happened.
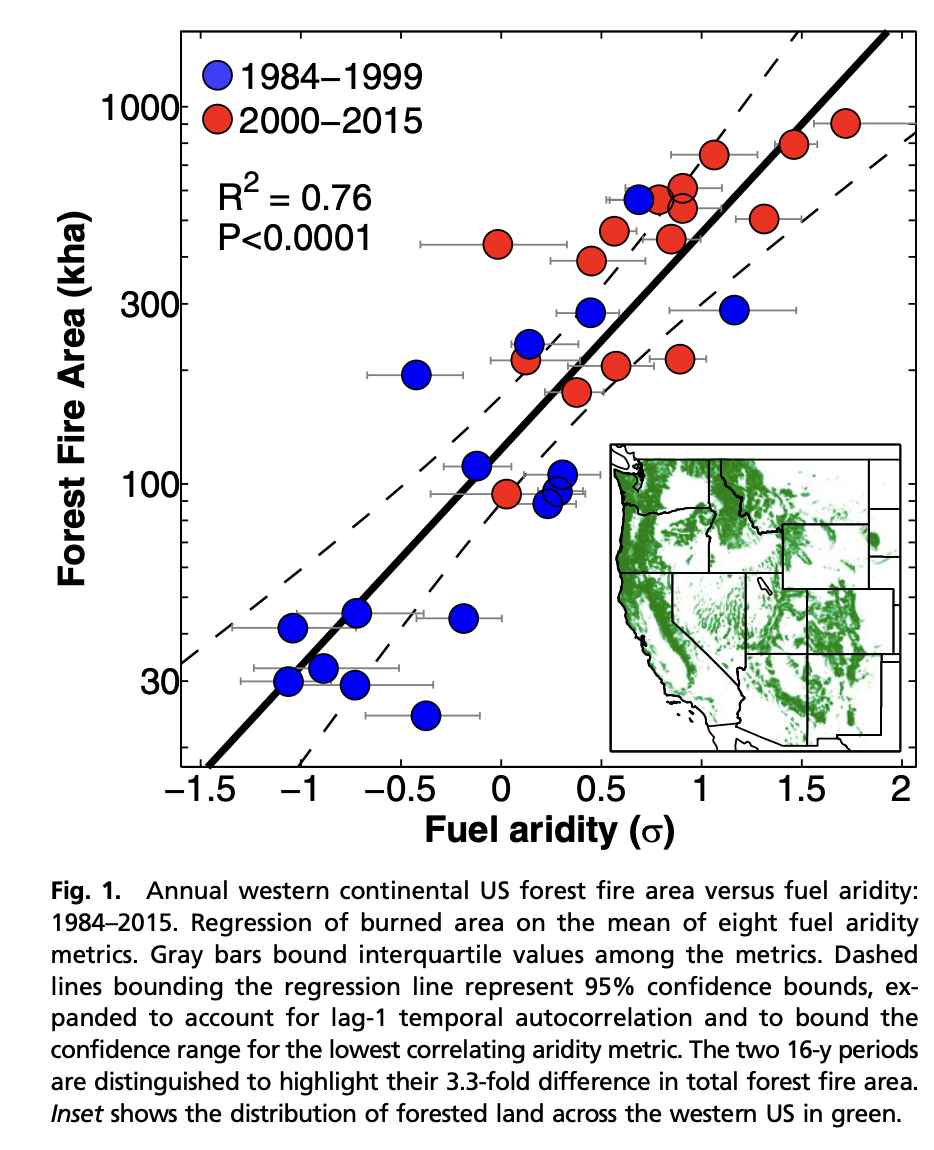
If one wanted to see how much of the trend is attributable to climate change one would have to model those oscillations (and control away the impact of human activities like forest management). Most such analyses use data from 1950 onwards, like Abatzoglou & Williams (2016). Nothing wrong with that! That time period should cover a chunk of cold and warm Pacific Decadal oscillations, but ideally we'd like to see a model that reconstructs the entire observed dataset of fires. Be that as it may, what the authors find is that half2 of the increase in aridity of the fuels present in US forests (and presumably, California) was due to anthropogenic climate change, with the rest being natural variation (possibly the oscillations described earlier). In turn, aridity is strongly correlated with burned area in a given year,
Note that the Abatzoglou et al. paper does not account for a long list of effects, including human activity preventing or fighting fires, and this list contains causes that could both increase or decrease the fraction of wildfires attributable to climate change.
In focusing exclusively on the direct impacts of ACC on fuel aridity, we do not address several other pathways by which ACC may have affected wildfire activity. For example, the fuel aridity metrics that we used may not adequately capture the role of mountain snow hydrology on soil moisture. Nor do we account for the influence of climate change on lightning activity, which may increase with warming (40). We also do not account for how fire risk may be affected by changes in biomass/fuel due to increases in atmospheric CO2 (41), drought-induced vegetation mortality (42), or insect outbreaks (43). Additionally, we treat the impact of ACC on fire as independent from the effects of fire management (e.g., suppression and wildland fire use policies), ignitions, land cover (e.g., exurban development), and vegetation changes beyond the degree to which they modulate the relationship between fuel aridity and forest fire area. These factors have likely added to the area burned across the western US forests and potentially amplified the sensitivity of wildfire activity to climate variability and change in recent decades (2, 22, 24, 44). Such confounding influences, along with nonlinear relationships between burned area and its drivers (e.g., Fig. 1), contribute uncertainty to our empirical attribution of regional burned area to ACC. Our approach depends on the strong observed regional relationship between burned area and fuel aridity at the large regional scale of the western United States, so the quantitative results of this attribution effort are not necessarily applicable at finer spatial scales, for individual fires, or to changes in nonforested areas.
Aridity here is a mean of eight different metrics of "fuel aridity",
Four metrics were calculated from monthly data for 1948–2015: (i) reference potential evapotranspiration (ETo), (ii) VPD, (iii) CWD, and (iv) Palmer drought severity index (PDSI). The other four metrics are daily fire danger indices calculated for 1979–2015: (v) fire weather index (FWI) from the Canadian forest fire danger rating system, (vi) energy release component (ERC) from the US national fire danger rating system, (vii) McArthur forest fire danger index (FFDI), and (viii) Keetch– Byram drought index (KBDI).
As an aside, if we pick one of them, like vapor pressure deficit, we get the same results.
Vapor Pressure Deficit
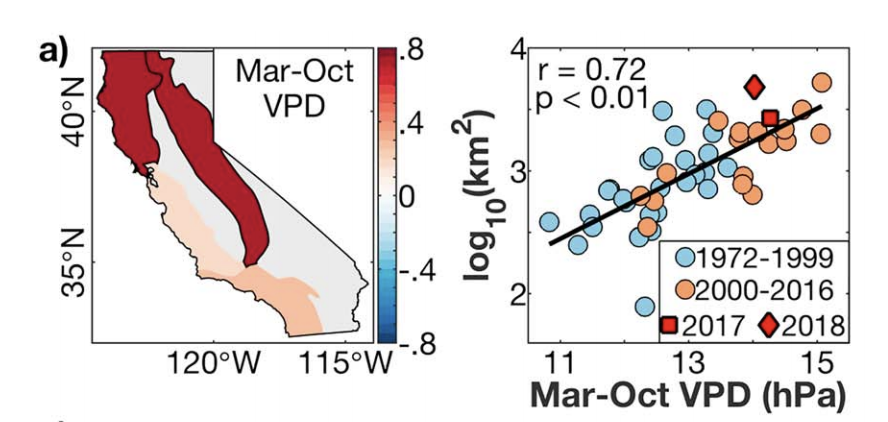
VPD measures the difference between the amount of moisture in the air and how much moisture the air could potentially hold when it’s saturated.It’s often measured in pounds per square inch (psi) or kilopascal (kPa).A high VPD (greater than 1.0 kPa) means that the air can still hold a large amount of water. High VPD means that rather than droplets of water staying on or in plants, they will be sucked up into the air (warmer air can carry more water), thus high VPD leads to drier terrains and drier terrains leads to, in general, more fire. VPD also correlates reasonably well with burned area across the Western United States in general and California specifically (Higuera & Abatzoglou, 2020, Park Williams et al. 2019). The relationship seems exponential: More VPD, exponentially more fires.:
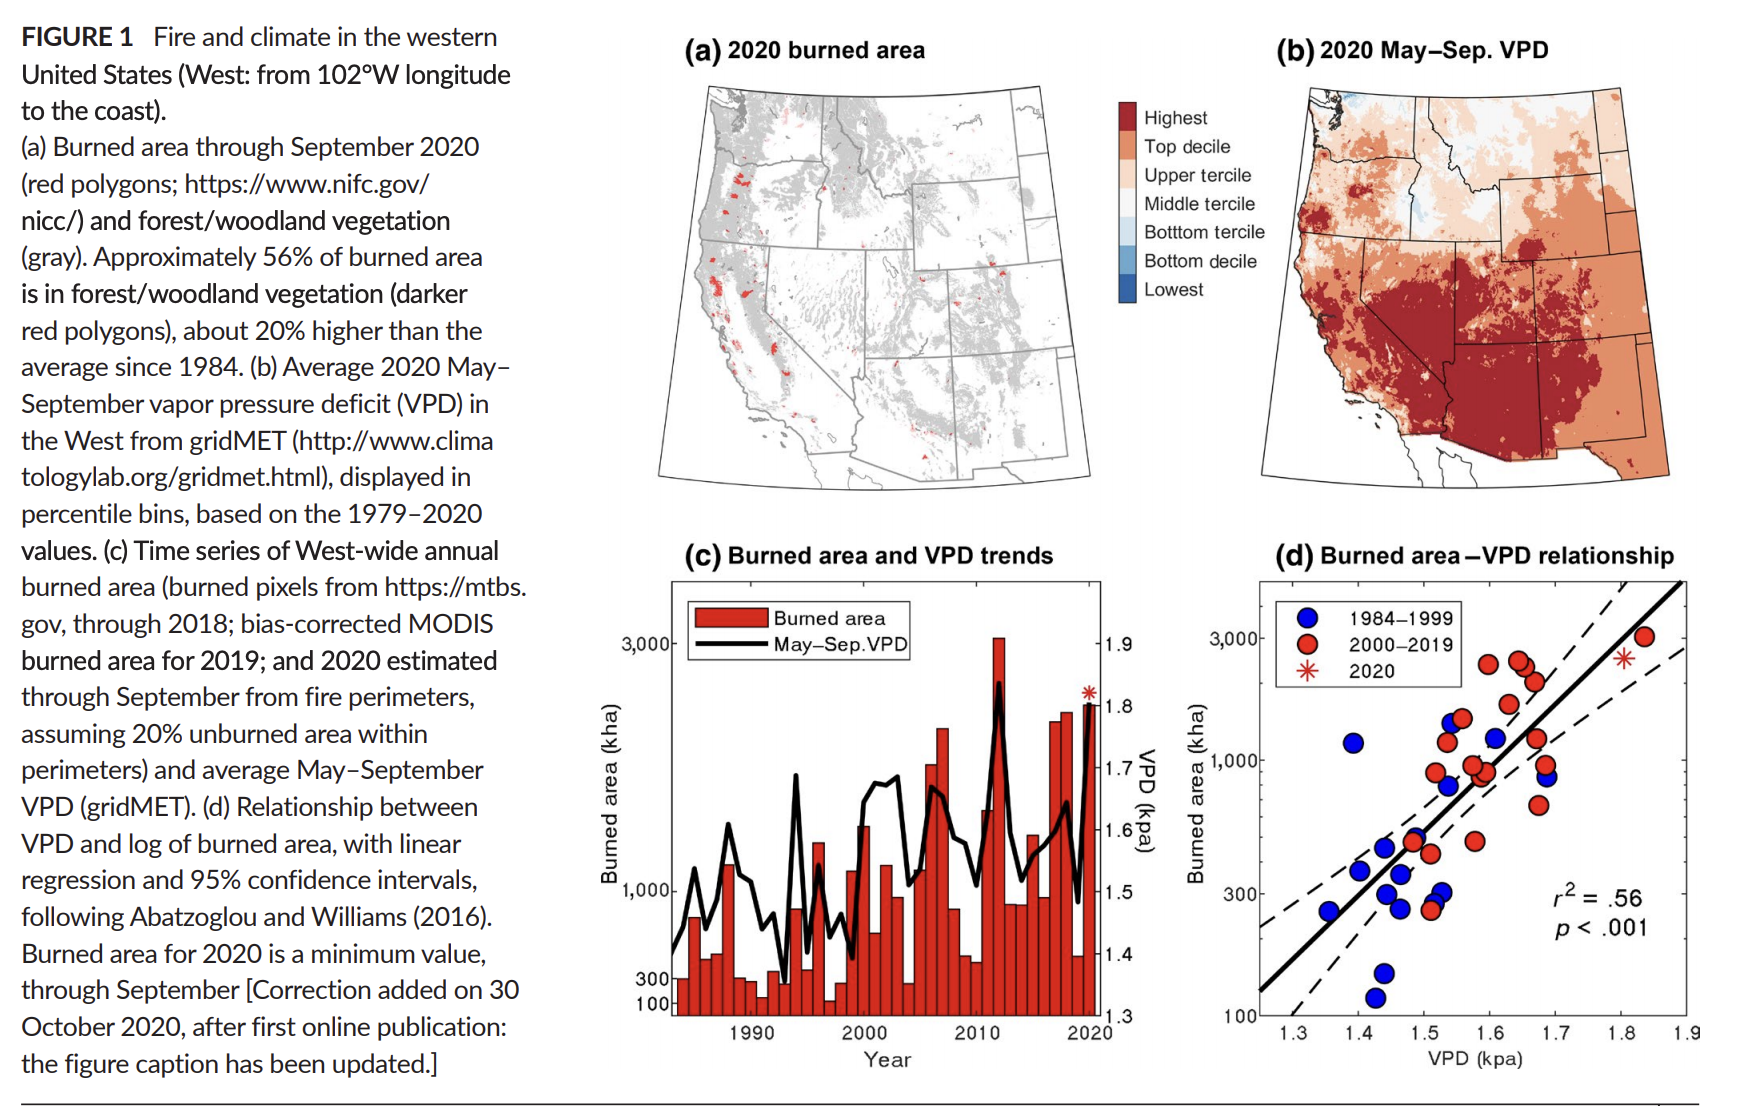
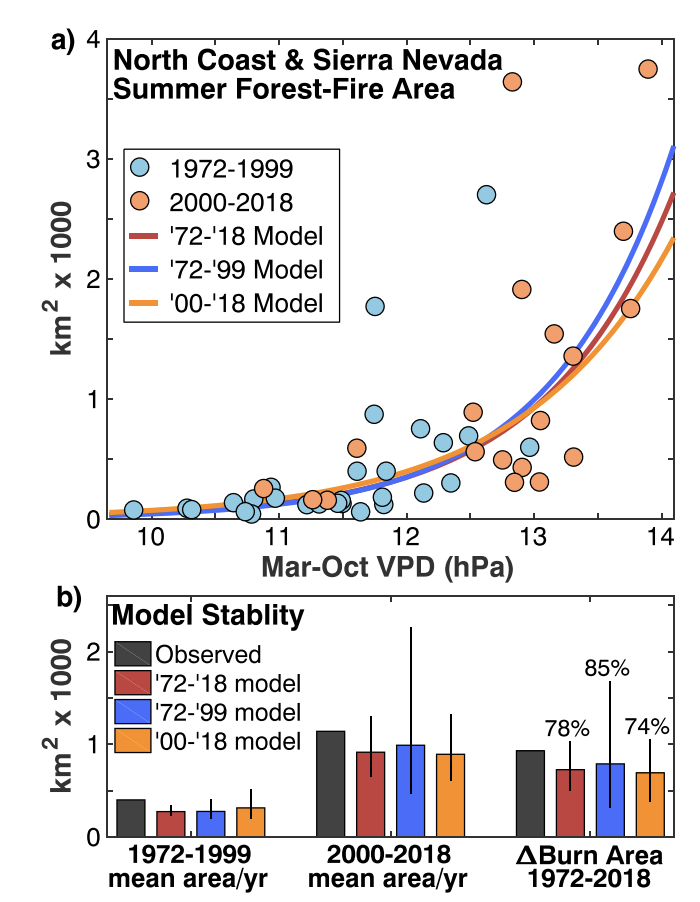
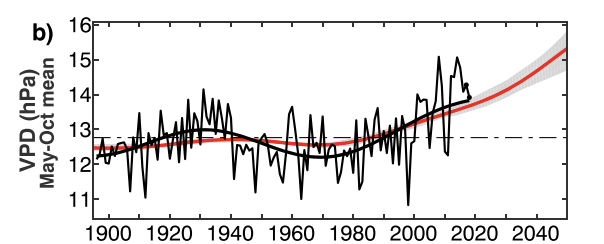
It won't be too surprising to say that VPD is going up as temperatures rise, but also note that it also presents an oscillatory component (black) that is not well captured by the CMIP5 climate model ensemble (red). This oscillation may help explain why there were so many fires pre 1950, why there was so little fire in the intermediate years, and why there is so much fire now. Eyeballing the period of the oscillation, it may be caused by the Pacific Decadal Oscillation. If so, we may have reached a peak and will get some rest from the rising trend from a few years, but given the underlying rising trend from climate change, that won't be more than a temporary slowdown of the increase rather than an absolute respite:
Note that the correlation should break down at sufficiently high VPDs: once a lot of California has burned, that naturally delays the occurrence of further fires.
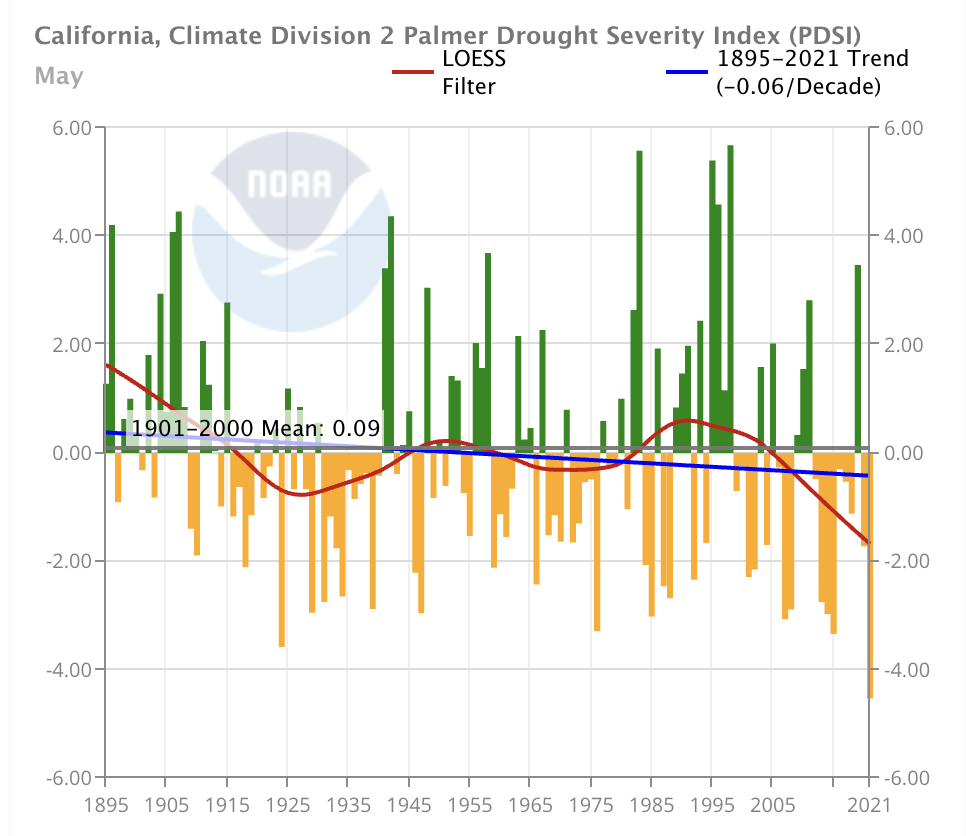
California is indeed getting more dry over the years even when considering data going back more than 100 years which should cancel our periodic oscillations: there remains a trend towards dryness.,
So climate change is acting in the expected direction: California is getting warmer and drier and these two, by virtue of the thermodynamics of combustion will lead to, ceteris paribus, more fire in the future. Note that effect is true in general but not always. While drier fuels burn more, if the weather is sufficiently arid, plants will just stop growing: in the very extreme case, that's a reason why the Sahara desert doesn't see much fire activity despite it being an extremely hot and dry place. Later on I discuss a study that finds this dynamic in a specific area of California.
I also created an animated version which helps to emphasize how weather conditions during California's fire season have evolved over time. #CaliforniaFires #ClimateChange pic.twitter.com/gkuRrdn2ZG
— Dr. Robert Rohde (@RARohde) November 12, 2018
The historical fire record
As I mentioned earlier, a key point of the "it's not climate change" argument is that there used to be substantially more fire in the pre-1800s past than there is now.
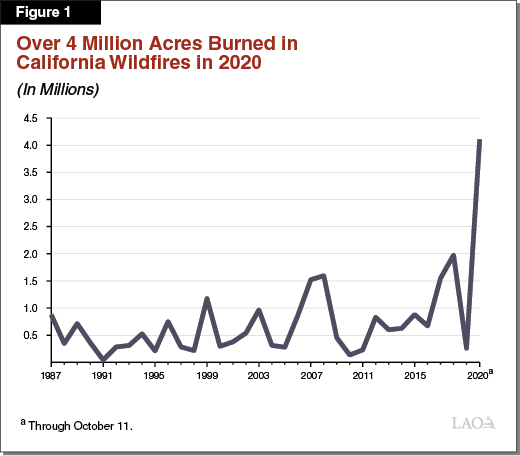
In 2020 around 4.4M acres burned which was considered to be the most acres ever burned in the record. And indeed it is, unless we go before 1950. If we do that, going all the way pre-1800, we find that the average acres that burn in any given year is 1.8M hectares, or around 4.4M acres (Stephens et al., 2007). This average is equal to the worst year ever in recent history, so one could tell a story here of California returning to normal after a period of trying to fight the inevitable (the climate-given steady state of burned acres per year). Should we tell this story? Michael Shellenberger goes for that, where the rarity is not the recent uptick in fires, but the anomalously low amount of burns that preceded the current era, fruit of a century of aggressively fighting fires, which leads to overgrown forests, creating more fuel for fires to spread. This wouldn't mean that climate change is not contributing to the effect, increased temperatures and aridity would contribute to an increase in that steady state of burned acres per year, it's just that we are now being pulled back from an unsustainably low level. Shellenberger goes as far as saying that we should probably stop blaming climate change for the fires. As I hope my discussion above clarifies, climate change is playing a role.
There's more to pre-1950 fire records than the 1800s data. That was also an era of building railroads, burning forests to clear up land for farming, and having less knowledge of firefighting or even having means to suppress some of those fires. We should go even further into the past, and there's some work doing that: Marlon et al. (2011) say that considering even longer time scales while there was a peak in fire activity centered in ~1890 that wasn't the situation all the way into the past. Prior to that there was, it is true, more fire than there is now, but not as much as that intermediate era.
Marlon et al. note that there is, as of the date of writing the paper, a "fire deficit" (noted also by Baker, 2015) relative to what one would expect from historical climatic patterns: not enough is burning. A decade later, we're perhaps now seeing how that gap is being closed by means of the most damaging fire seasons ever.
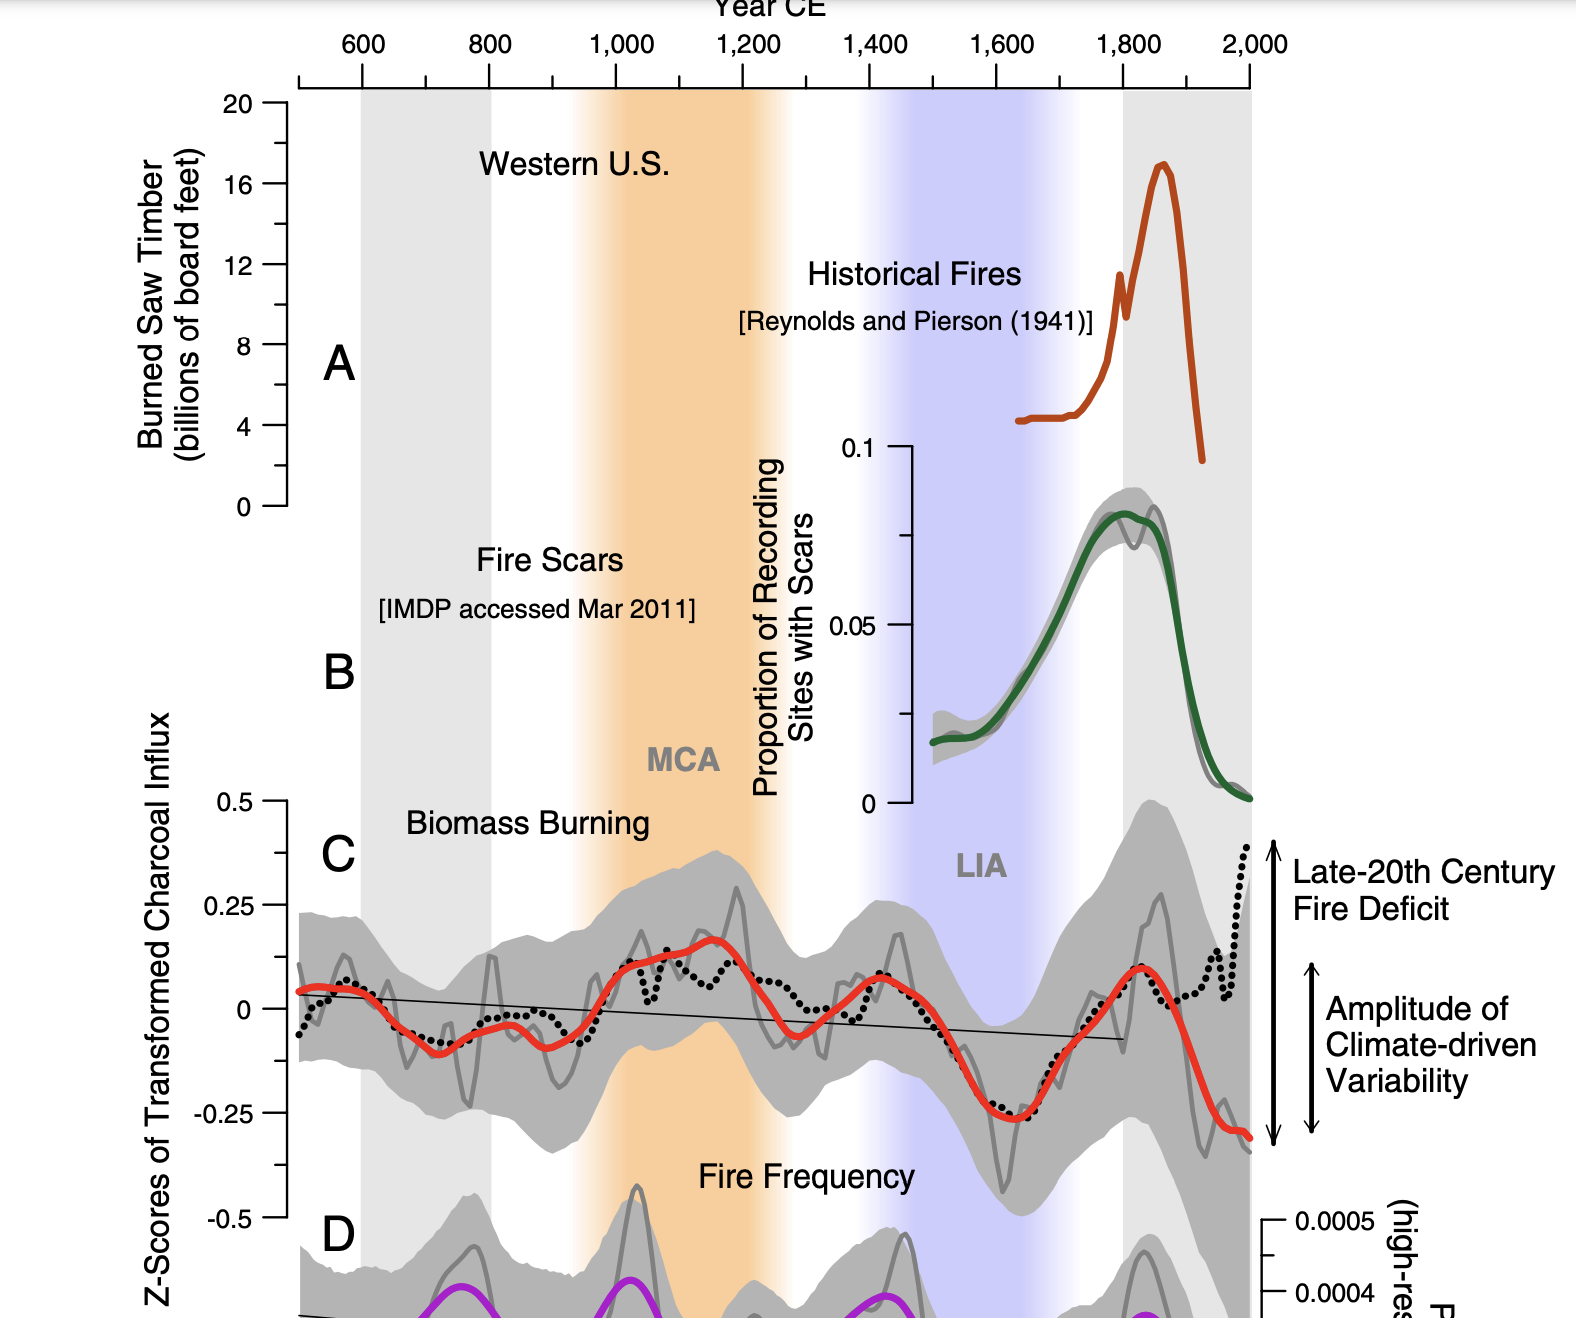
This fire deficit is even more striking if one plots (as Marlon et al. did, in the supplement) the historical record of predicted charcoal influx (a proxy for fire) using climate and the observed record,
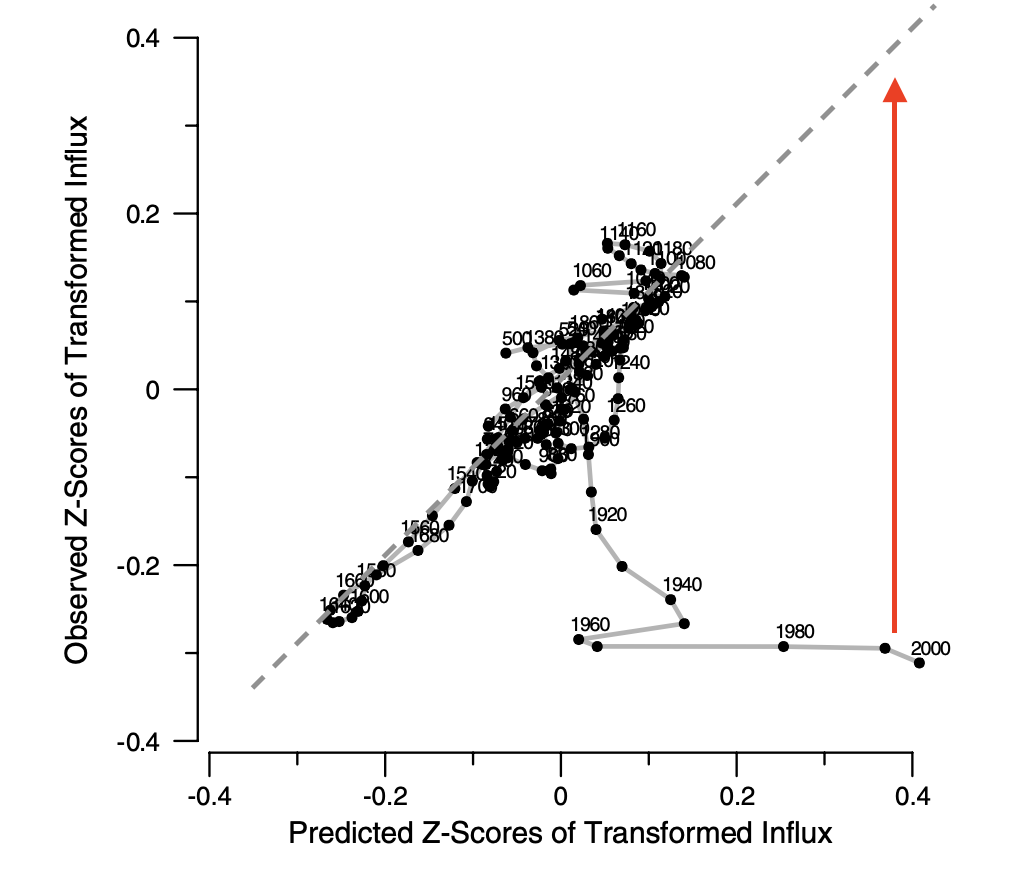
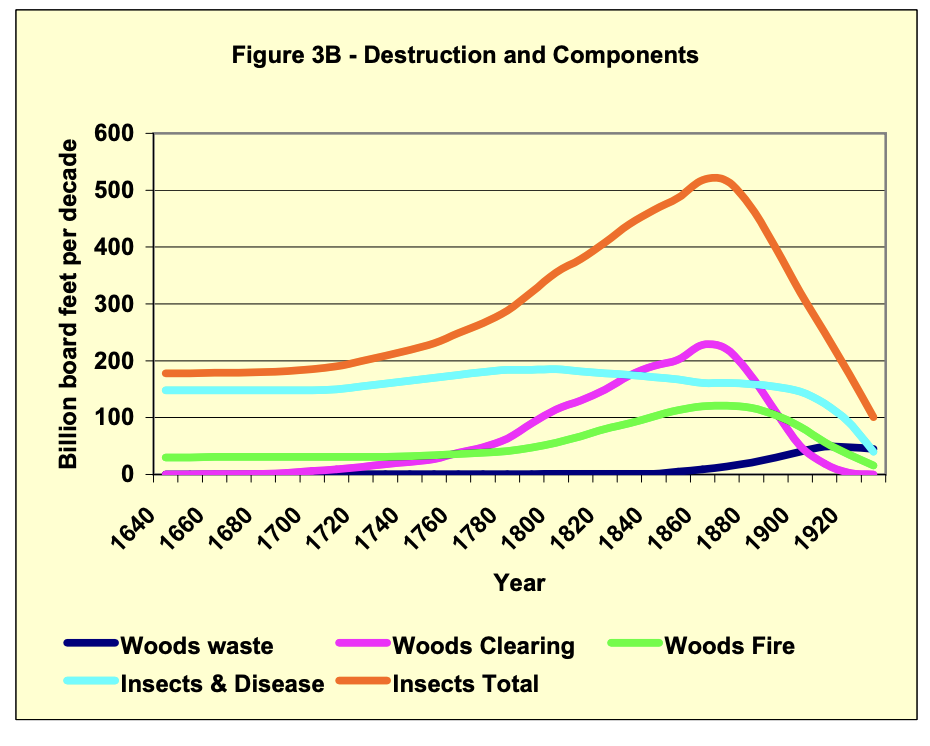
If curious about that "Reynolds and Pierson (1941)" reference there for historical fires, I managed to track down something that claims to be a scanned text of that. It contains this figure, which should be the figure "A", stretched over a longer axis. How much should we trust this? I don't know! It contains causes of tree destruction other than fire, but converting board feet per decade to acres is not trivial. At say 5-15k board feet per acre, the surface burned in the 1600s might have been between 1.3 and 4 million acres per year (this latter being closer to the figure from Stephens earlier so the order of magnitude checks out).
Though perhaps some of that bump is not real, but rather prescribed fire (or woods clearing) done illegally (albeit in a controlled fashion) that the Forest Service would regardless classify as wildfire.
Why do the fires start?
Climate change and forest management may make fires worse once they start, but what triggers them?
Typically most of the damage caused by wildfire is due to a handful of fires (Strauss et al., 1989); in the 2020 California wildfire season, the aggregated 38 fires that comprised the August Fire Complex burned almost a quarter of the entire surface area that burned that year, despite those 38 fires being just 0.38% of the 9917 fires reported during 2020. This particular fire was due to lightning storms. The same is true for the rest of the mega fires of 2020, the SCU Lightning Complex, LNU Lightning Complex, North Complex, or SQF Lightning Complex.
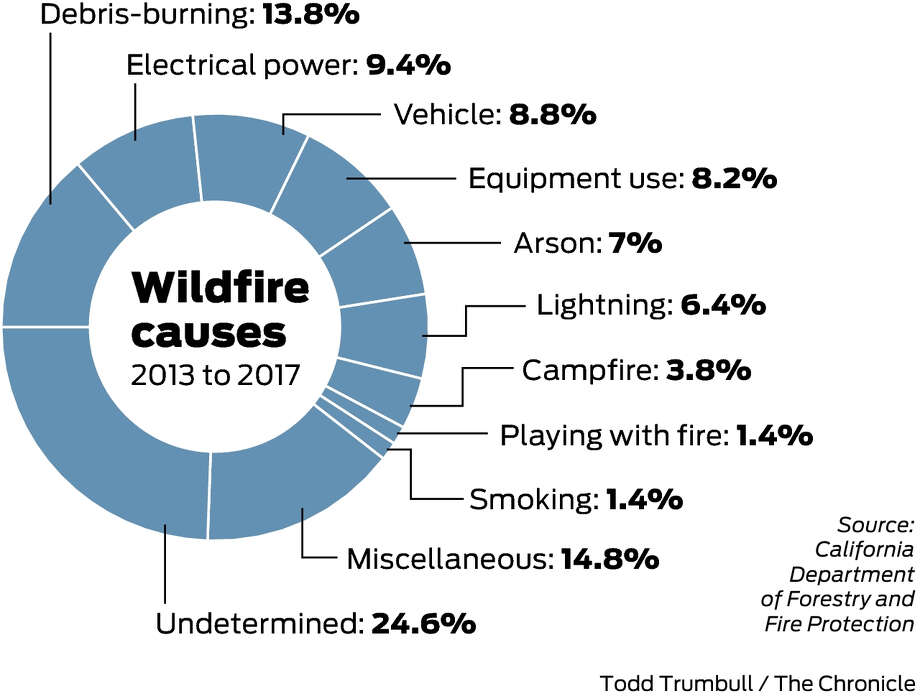
This is not always true: In 2018 the worst fire ever (by insured losses rather than area burned), the Camp Fire was started by a faulty power line; and more broadly there are more fires that start due to electric power lines than there are due to lightning,
But we should remember that what matters is not necessarily what starts the most fires, but rather what leads to the most damage.
According to Cal FIRE, 6 out of the top 20 most destructive fires (by structures burned and deaths) were due to faulty powerlines. Some of the other ones are due to trivial incidents as in the Carr fire case where Coincidental to the name of the incident, the fire was started when a flat tire on a vehicle caused the wheel's rim to scrape against the asphalt, creating sparks that set off the fire. Or the Valley fire where a wire at a poorly connected hot tub overheated, melted and ignited dry brush nearby at a home in Cobb town. Or the Mendocino fire where the [Ranch] Fire was started by a rancher who had inadvertently sparked dry grass while hammering a metal stake while trying to find a wasp nest.
Thus, from a prevention side, whereas there is a long tail of potential causes of fire that are hard to control, maintaining or under grounding powerlines is the one thing that could be done to reduce the most devastating of fires in terms of human lives and damaged structures.
Natural fires matter: health costs
On the other hand if we care about acres burned the thing to do is worry about lightning-started fires, and we should care about this because it's likely that the structures that burned+deaths approach to quantifying damage underestimates the true costs of wildfires. One would have to add the economic costs of individual wildfire mitigation (buying air purifiers), the inability to enjoy the relevant natural areas (from which many derive great value), or the damage from millions of people breathing polluted air. Acreage should not be "the" metric to reduce (as suggested here), but it is still a major part of the equation. To make the point more clear, there is work attempting to quantify the impact of wildfire-produced air pollution on health; Wang et al. (2021) estimate that the California wildfires of 2018 alone, via increases in mortality risk, caused the death of 3652 people which is 35x more than the lives lost directly due to the fires3 . This is a very important point: this kind of indirect damage due to pollutants is not always considered in cost-benefit analyses of the wildfire equation: The National Fire Protection Association, which is often quoted as an authority for cost of wildfires does not include health-related costs in their calculations. Or the wikipedia cost calculation figure the 2018 wildfires cites a 26.35bn$ loss whereas the Wang et al. paper, adding in health losses and indirect (counterfactual loss of economic activity) losses has a total of 148.5bn$. Chapter 5 of this has an extensive review of the effects of wildfires on health. The reason why this might be is that it's easier to notice that the damage is there (a burning building is easier to see than inflamed lungs) and assigning a value to rebuilding a building is easier than modeling the cost of that particulate matter getting into people's lungs. Fortunately, this is starting to be acknowledged and the California's Wildfire and Forest Resilience and Action plan has a section on reducing the health effects of smoke (p.34). The Cost of Wildfire in California (2020) report considers health effects as well.
This is a very basic understanding of the issue, but one that gets us to a more informed level than this PBS article that claims that 95% of fires are due to human causes. That may be the case, but most of fires are small and irrelevant, what we care about is causes, weighted by seriousness: fires caused by lightning strikes still should be a major cause of concern.
The WUI conundrum
Many people in California live in the so-called Wildland-Urban Interface (WUI). I recently took a trip up to Larkspur (Marin County) to do some research. This is what the WUI might look like at that particular place,
The WUI features repeatedly in the California wildfires discourse:
First, there's the point that new construction at the WUI has been increasing rapidly increasing both the damage caused to humans (hard to have wildfires in tree-less San Francisco) because of urban dwellers being pushed out of cities due to increasing house prices as well as increased odds that human activity will cause more fires. This point is correct.
Second, as a prescriptive measure resulting from the above diagnosis, there are calls for moving people out of the WUI. A few of the fires I mentioned earlier started here: the faulty hot tub that started the Valley Fire is another example of WUI. More people, more chances someone does something that could start a fire. Having more people near forests also requires having more electric lines (that for cost reasons tend to be built overground) which can also lead to accidental fires. To me the key issue is not whether people expose themselves to risks to their person and property by building there; rather the issue is that they are exposing others to huge risks by being there.
I am very reluctant to try to get people out of the WUI. As you can see from the linked StreetViews, WUIs are a great place to live! Depriving some of that opportunity to save California is for now a false dilemma: progress means not having to make tradeoffs and it may be that we can have our WUI cake and eat it as well.
There is a way out of this: Insurance. If people living in the WUI are both a major cause of fires as well as victims, can't insurance solve the problem? Higher premia would dissuade people from moving there, and -in a more extreme case worth exploring- could shift the responsibility of paying for causing the damage from the State to the insurers and through them, to the potential culprits, the same way it is done for nuclear reactors or cars. Mandatory third-party insurance, perhaps baked into location-dependent property taxes for wildfires would be a solution.
The closest we have, or rather used to have, to this is the CAL FIRE fee levied on habitable buildings in state land that are not incorporated. The problem with this fee is twofold: one, it's the same for everyone (unlike regular insurance), where higher risk areas should be charged a higher premium. Second, it doesn't apply to everyone! While hot tub owners of Cobb would be paying it, those of South Lake Tahoe would not.
The insurance mechanism on the victim side (paying those that suffer from wildfire damage) is sadly broken due to government regulation. What should happen is that premia should increase in areas prone to fire which in turn help dissuade new construction there on the margin. The California government, for example prevents insurers from dropping coverage in wildfire-prone areas. Where they can, insurers are in fact dropping customers. Why would insurers want to drop valuable customers? Because again the California government doesn't let them increase premia to actuarially fair levels: they have to ask for permission to raise them. Instead of a free market where insurers compete to fairly price risk, the imposition of price caps leads to the absence of service. There's a state-operated insurer of last resort, the FAIR plan which fortunately offers less comprehensive coverage than the private plans (So it ends up being expensive; perhaps not as expensive as it should be, but better than it would be if it were more comprehensive). Of course, California being California, the plan is to move in that direction, in effect offering a subsidy to those living in fire-prone areas.
Another potentially easy solution is to have building standards that enforce so called defensible space around the house, clearing up vegetation around the building, or building using fire-resistant materials (Sure we get it timber is cheap but concrete blocks are not that expensive4 ). Unfortunately again California is California: Whereas in San Francisco crime is de facto legal, current construction codes already ask for house builders to build houses in a reasonable way to reduce damage from fire and for owners to upkeep those standards. But if you look at any WUI area lots of people just don't do that. This is a broader theme in California: there is a gap between instituting laws and action plans and actually getting those executed. In any case, even when complied with, one could always demand even more restrictive standards here.
The creation of defensible space around a property, according to specific horizontal and vertical spacing criteria, is required by state law in State Responsibility Areas and in High Fire Hazard Severity Zones in Local Responsibility Areas, and/or by local ordinance. The specific requirements for defensible spaces are found in the Public Resources Code 4290- 4294 within California Building Code: Chapter 7A. Amendments to the CA building code in 2005, 2008 (SB 1595 Kehoe, Chapter 366, Statutes of 2008) and 2018 (AB 2911 Friedman, Chapter 641, Statutes of 2018) provided major updates to the code that increased defensible space requirements, including increasing the defensible space up to 100 feet and requiring more intense fuel management within the first 30 feet around a structure. State law applies fines of no less than $100 for a first infraction, increasing to a potential misdemeanor charge and a fine of no less than $500 for a third infraction. State law also allows insurance carriers to require more restrictive defensible space criteria than the 100-foot criteria in California’s building code. **There is no statewide audit of defensible space compliance with the state requirement and anecdotal evidence suggests compliance is uneven. **(The Cost of Wildfire in California)
Plot time!
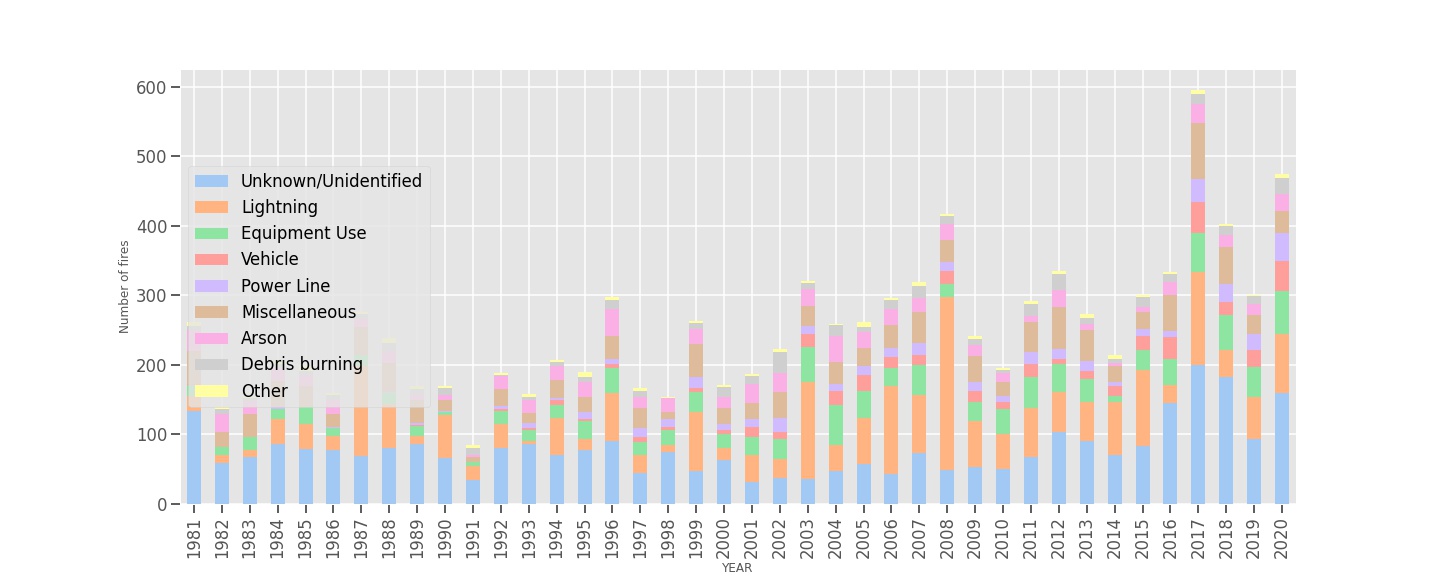
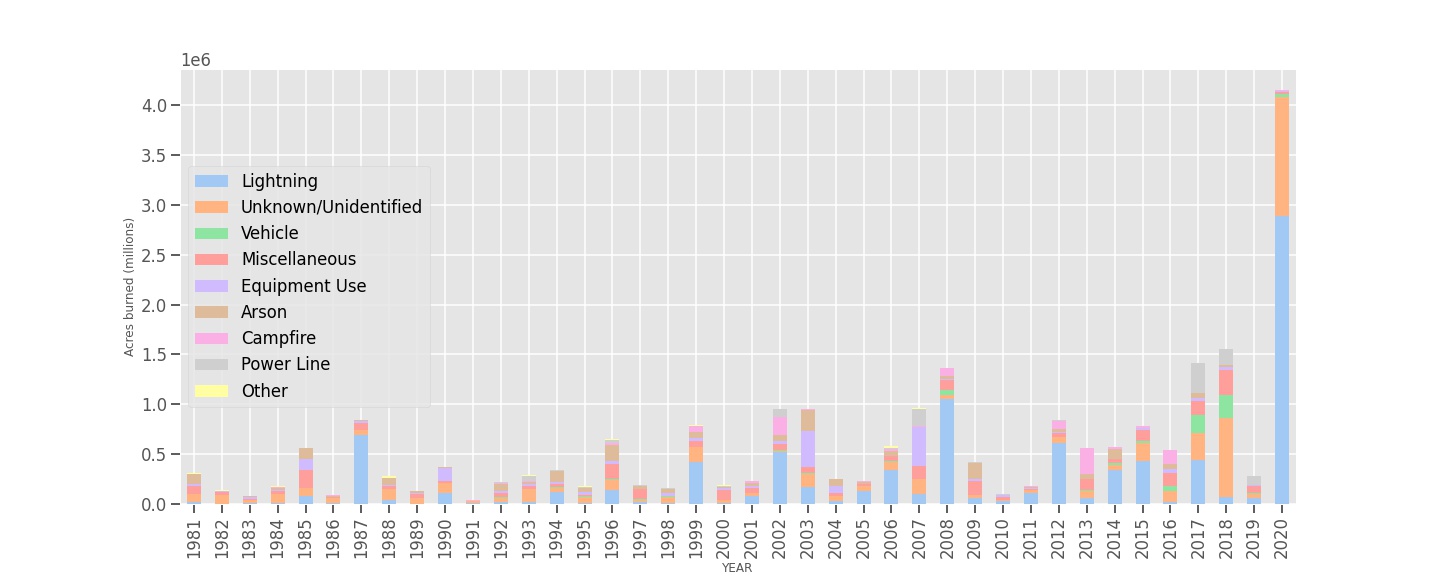
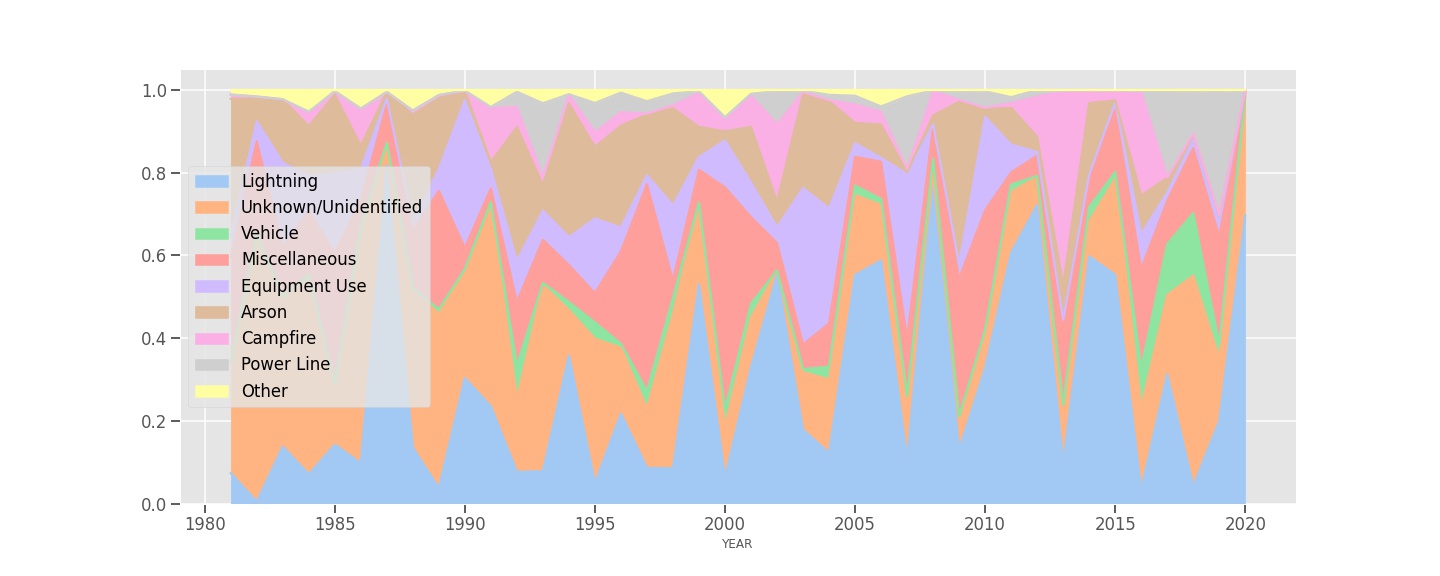
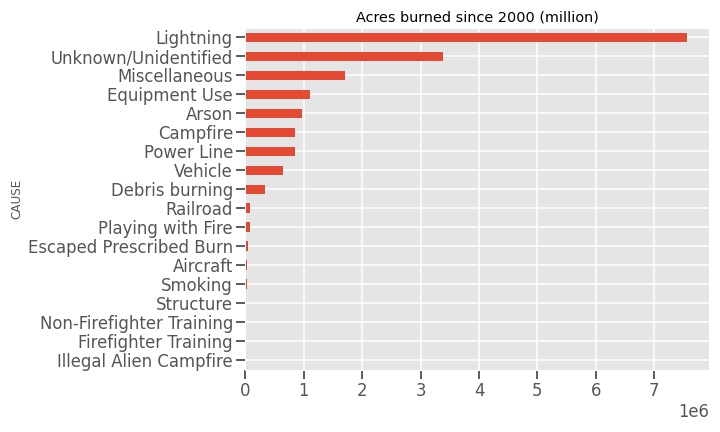
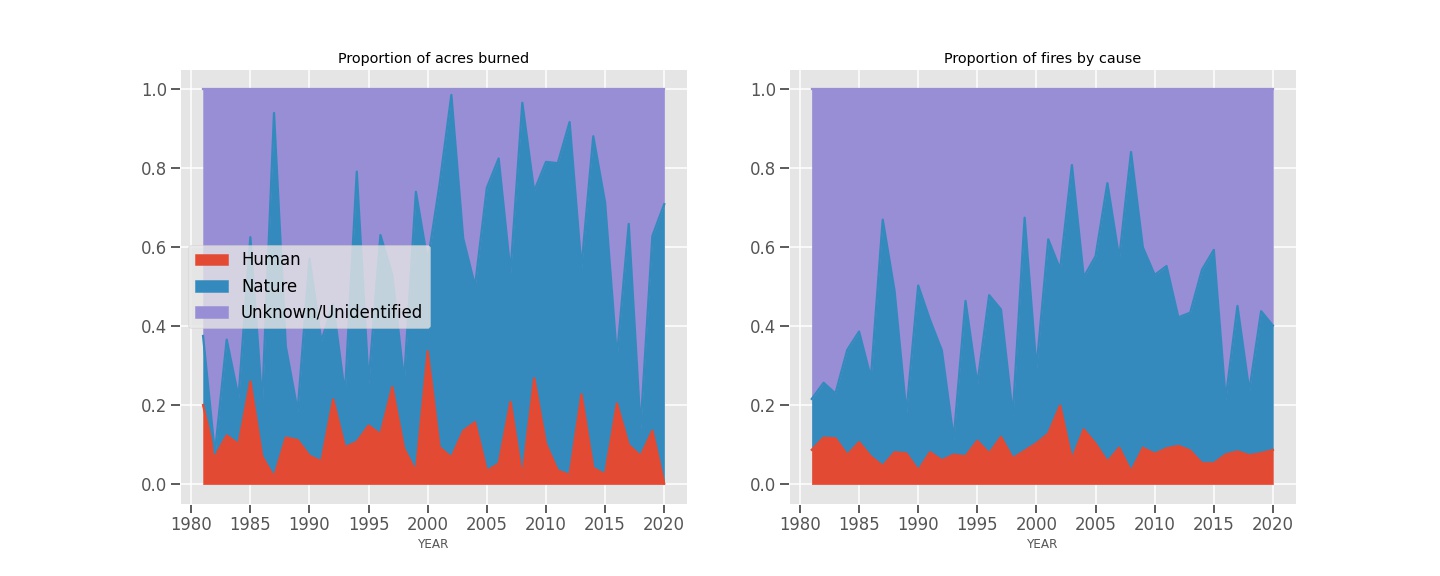
It wouldn't be a Nintil post without some plots. I took data from the Fire Perimeters database from CAL FIRE and plotted the area burned, the number of fires and so forth, divided by cause. The notebook used to generate the figures is available at the Open Nintil repository.
Note that this dataset focuses on the largest fires and not all fires so the figures for number of fires or acres burned must be interpreted with the caveat "by large fires". The difference between FRAP and other data sources is documented in Syphard & Keeley 2016, though 5 years have passed since that so possibly FRAP data is now more up to date. I checked a few years with other datasets like this and the numbers roughly add up.
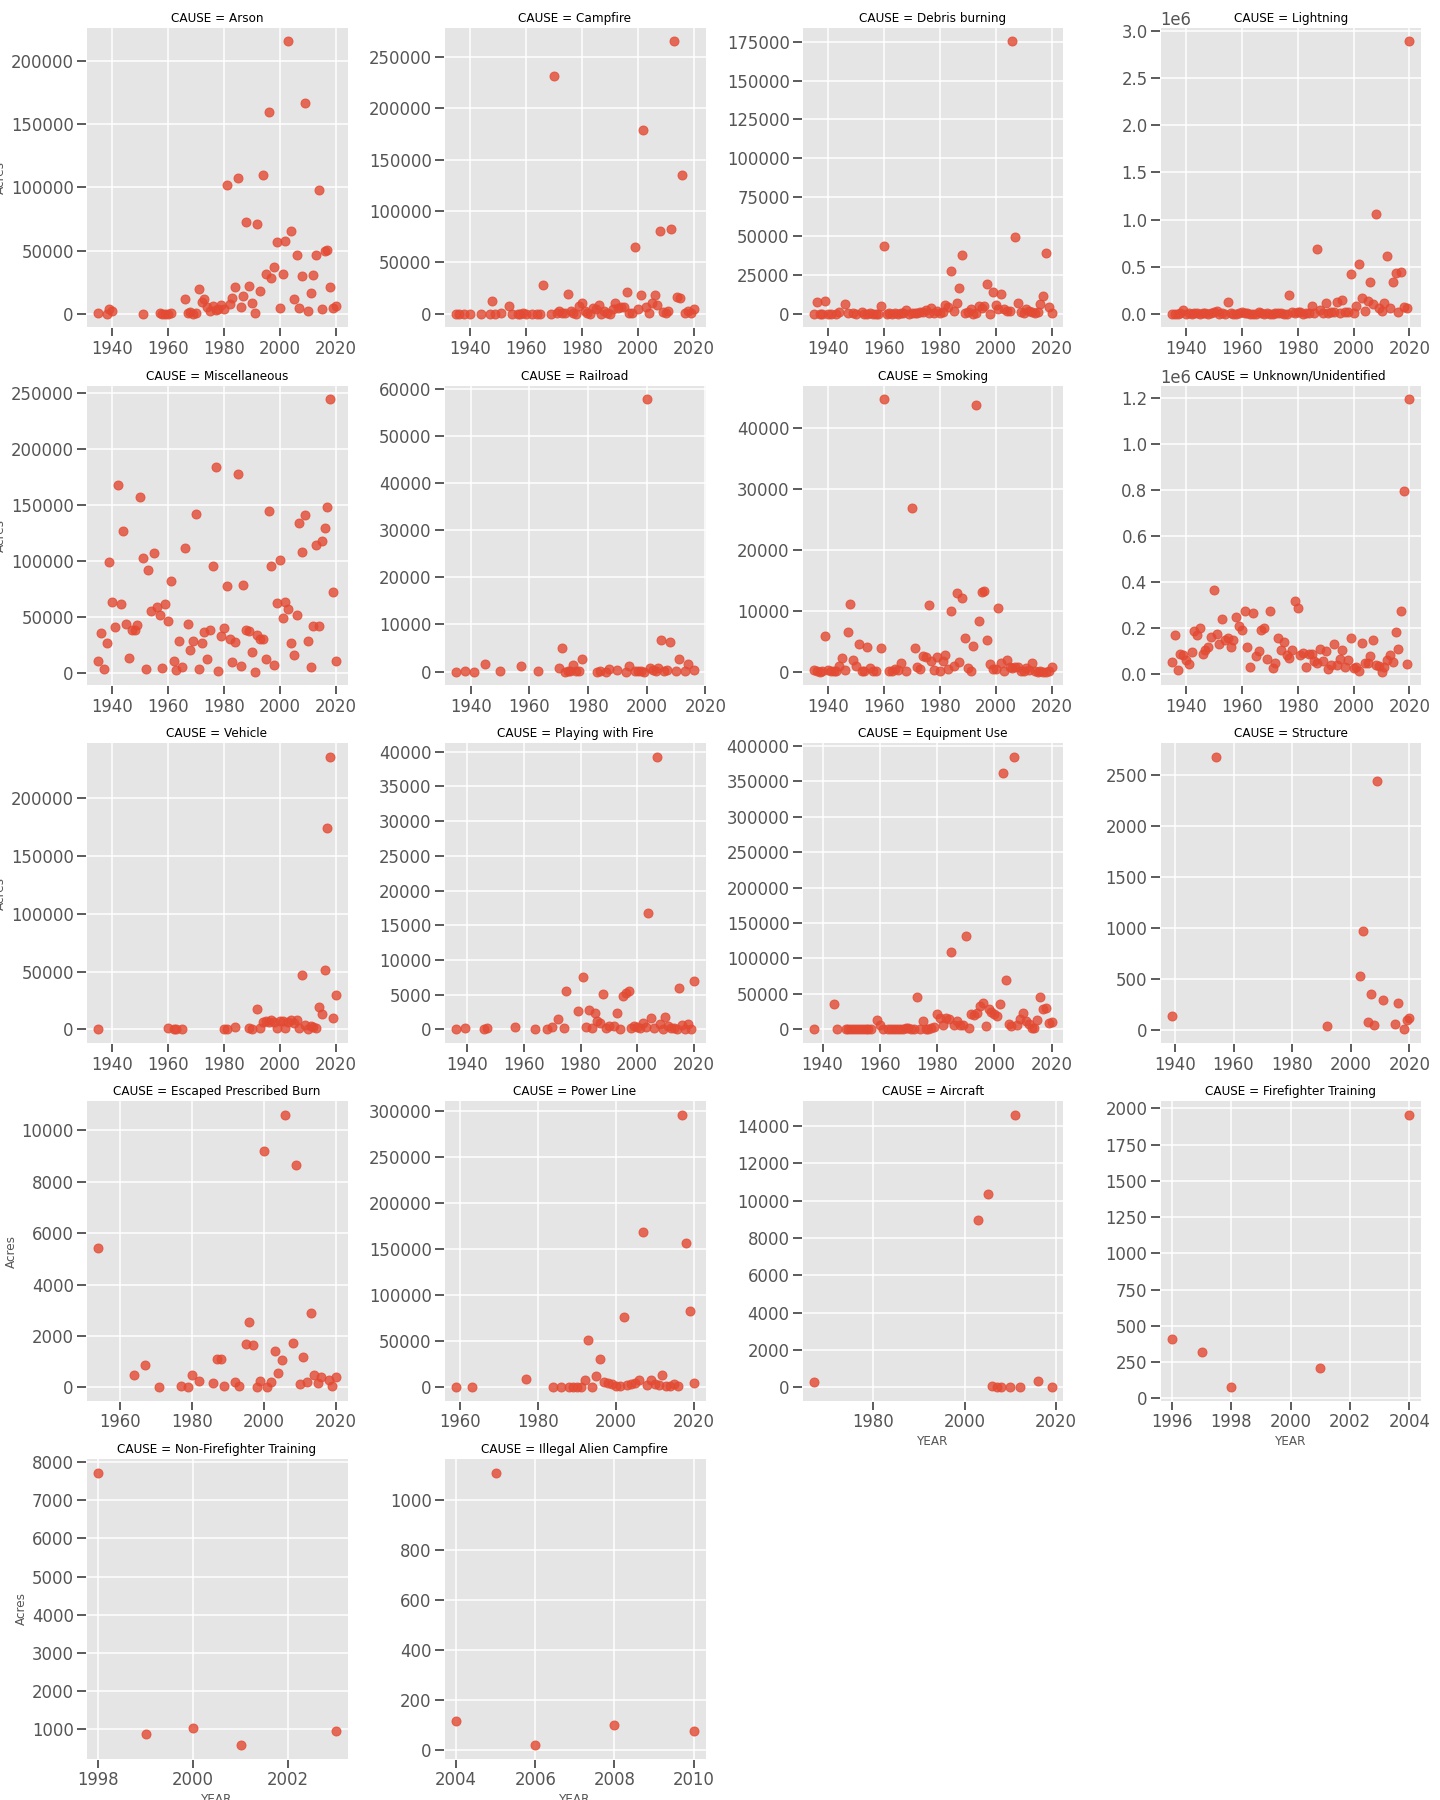
Same but in logarithmic scale, so it's easier to appreciate the trend (albeit at the cost of de-emphasising the outlier status of the last few years)
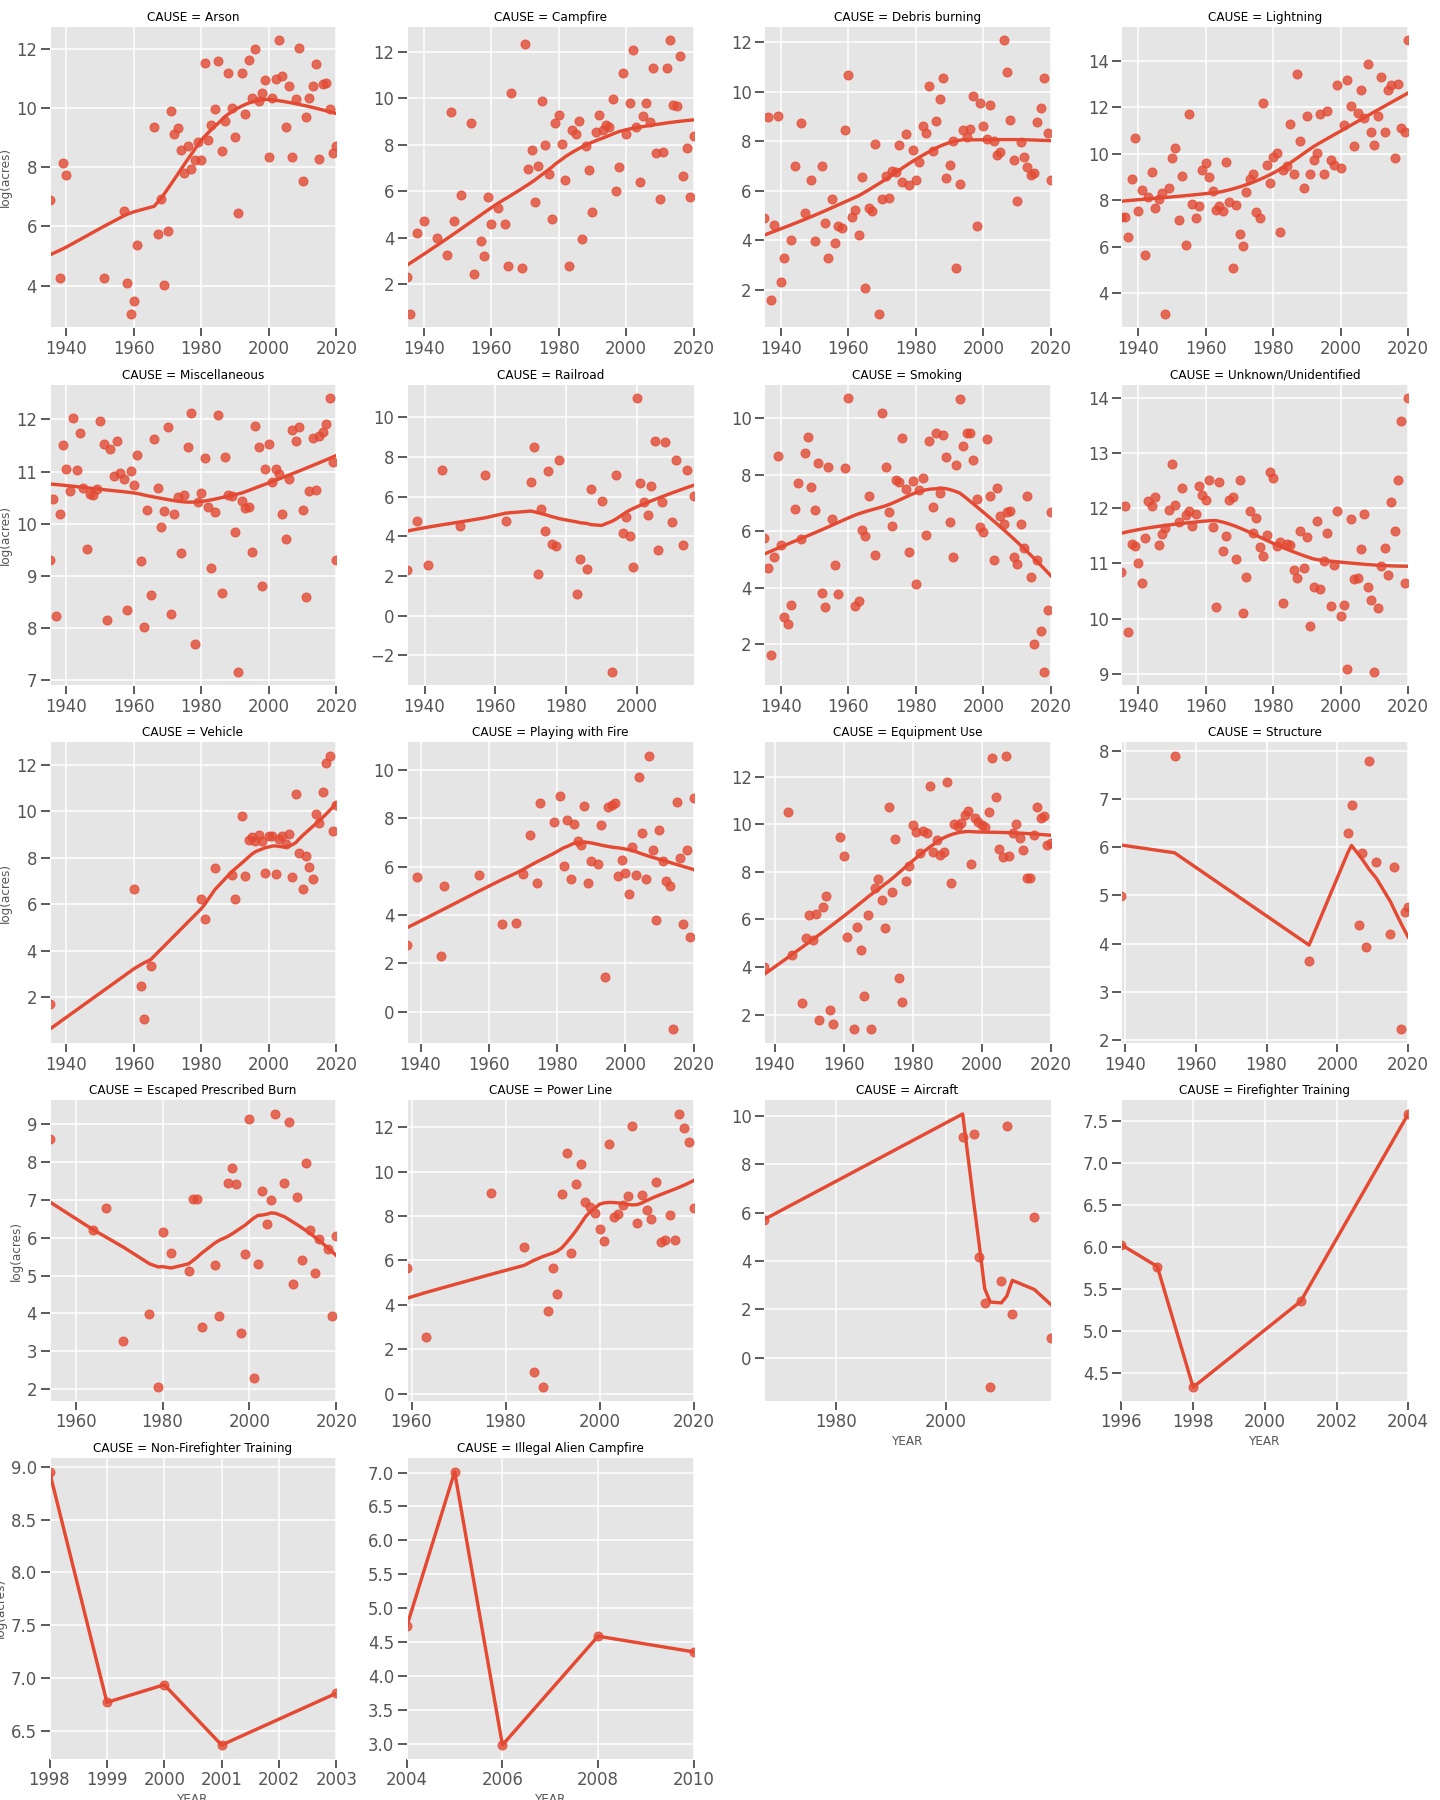
Regarding some of these trends; is is that we are seeing more lightning, or that the same amount of lightning is striking more arid fuels, leading to more fire? We know the latter is true, is the former true? Seemingly not, the amount of lightning (at least in the 1985-2000 period) has remained constant (van Wagtendonk & Cayan, 2008). It may be that lightning is overall increasing, but at least that period is evidence that we can see increasing lightning-caused fires without lightning itself being the variable that's driving it. This is not to rule out that lightning strikes are trending up in general (or in the 2000-2021) period.
Is the same the case for the human causes? Trying to disentangle that is harder because lightning is a discrete event whereas human factors include fire suppression, urban construction, roads, or power lines. Mann et al. (2016) tried to disentangle these relative contributions and find that even after controlling away the effect of climate change, on net human activity has still contributed to more fire.
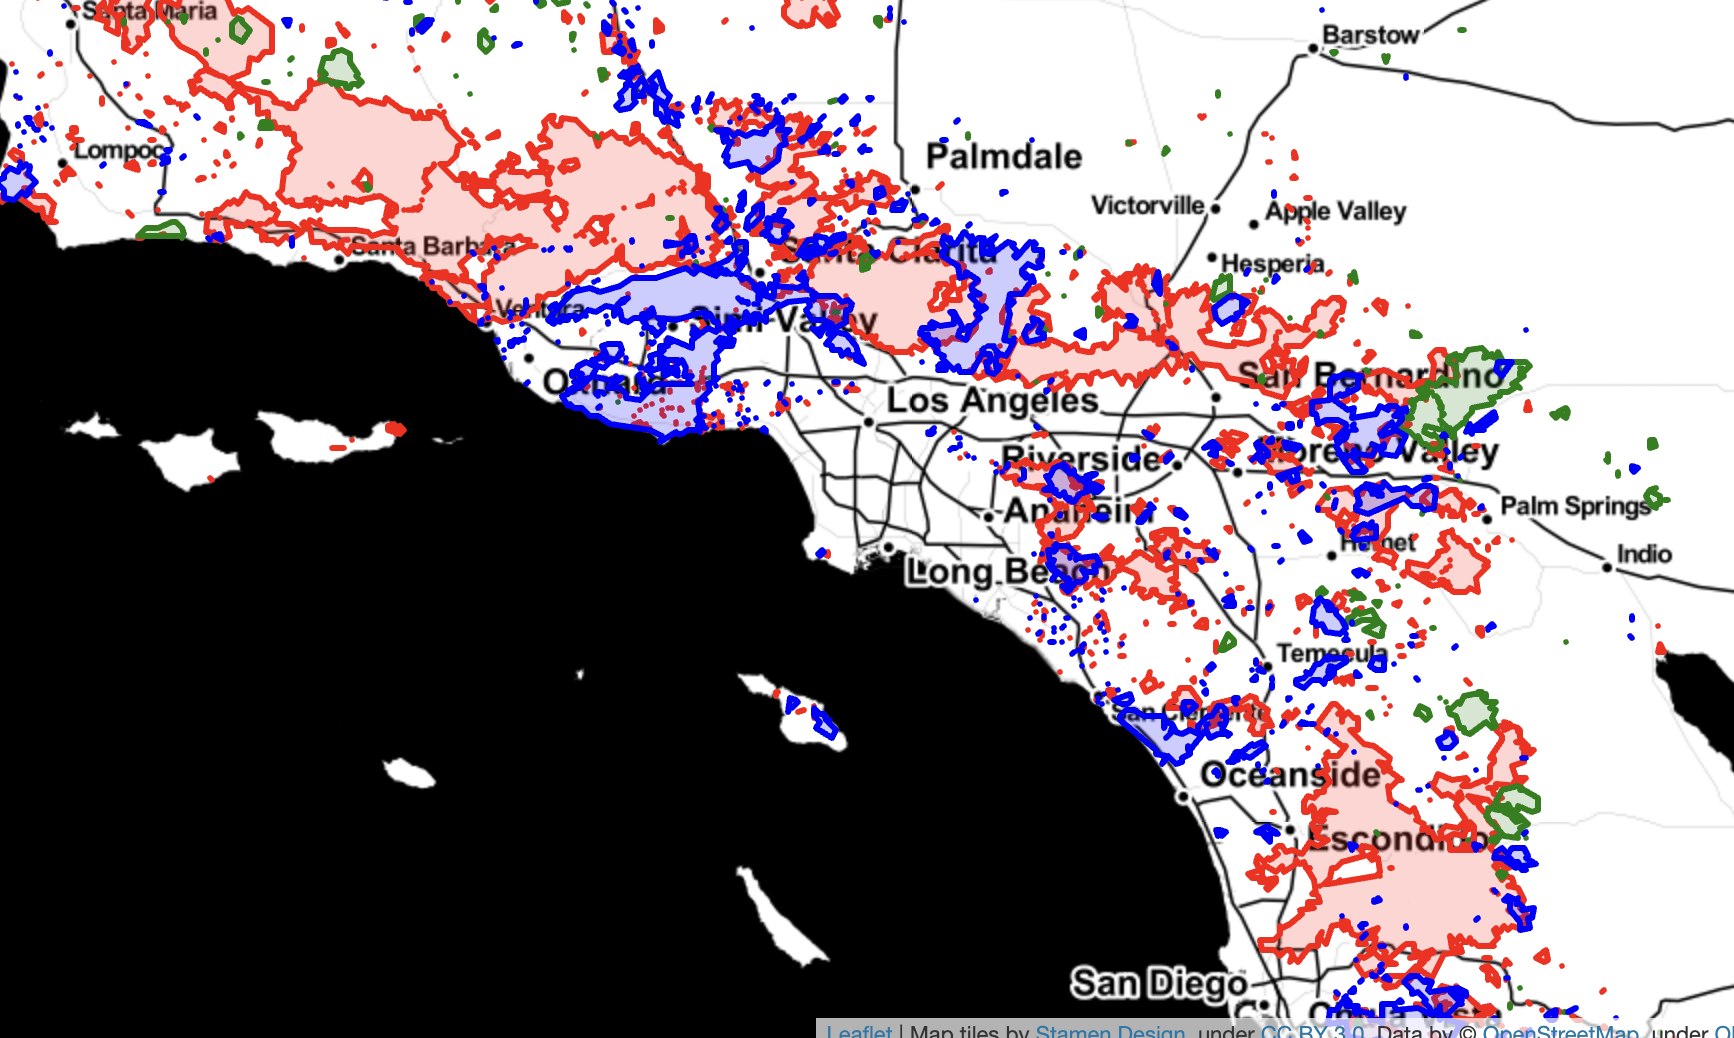
In these maps, red represents human-started fires after 2000. Blue represents fires of unknown cause. Green represents fires due to natural (i.e. lightning) causes:
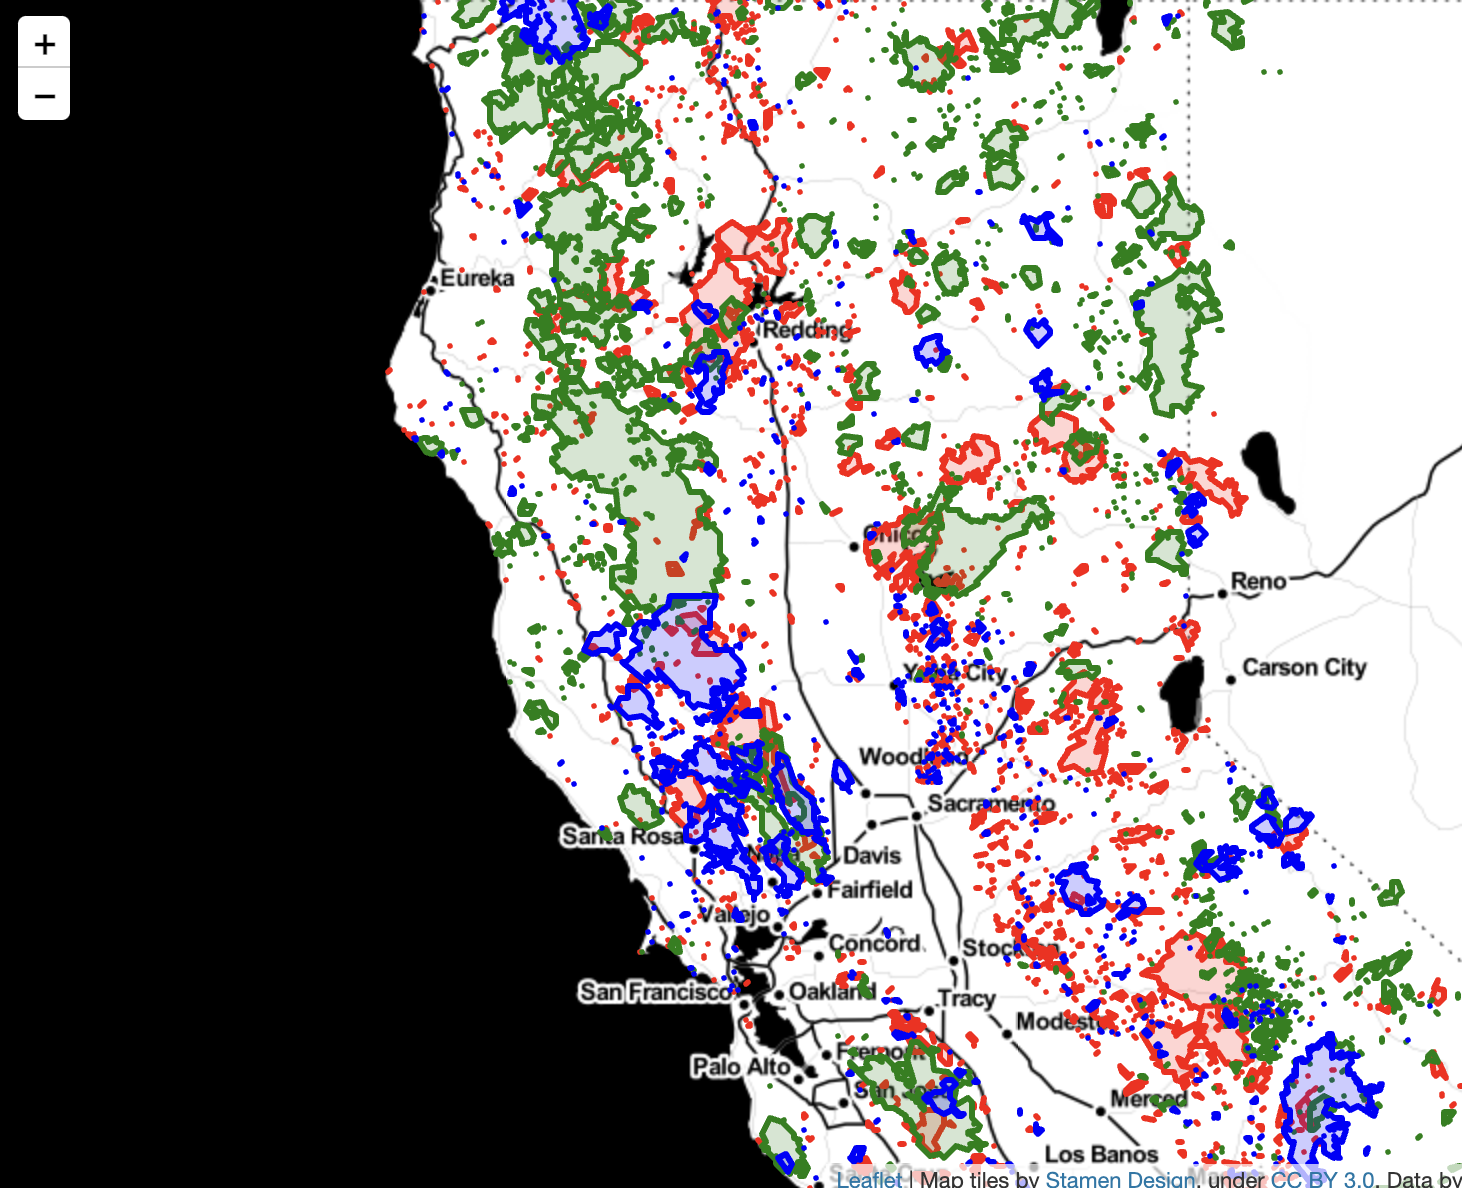
Some conclusions from this:
- There is a trend towards more area burned and more fires as well as towards an increase in the largest fires; whereas 30% of the fires were responsible for 90% of the area burned in a given year, now less than 10% of the fires (recently, less than 25 fires in a given year) account for most of the area burned. The takeaway from this: If we had good modeling tools and focus on the first predicted to be the worst, it's possible to avoid most of the damage. However this may not always be desirable, it's possible to leverage wildfires as tools to clear up vegetation (managed wildfire). More on this later.
- The leading cause of area burned, by far, is lightning strikes, followed by a surprisingly high fraction of 'Unknown fires'. Even for large fires in 2020, like the Creek Fire we still don't know their cause. After that there's miscellaneous and equipment use.
- Miscellaneous is a grab bag of things. Some examples: La Brea fire (2009, A cooking fire at a marijuana drug trafficking operation), Ferguson fire (2018, Faulty vehicle catalytic converter), Detwiler fire (2017, firearm-related) or the Rocky fire (2015, failure of a gas water heater near an outbuilding that contained flammable liquids)
- Equipment use seems a bit like miscellaneous in that there are many things bunched under the category. Cedar fire (2003, signal fire out of control), Zaca fire (2007, sparks from a grinding machine on private property being used to repair a water pipe), or the Moonlight fire (2007, related to a logging company)
- Didn't we say earlier that, according to some sources, 95% of the fires are started by humans? And yet the FRAP data says that humans never account for more than 20% of fires in a given year (Even if one considers all the unknown causes to be human-related). This is because FRAP only considers meaningfully large fires (I was able to find fires from sheds so it's unclear what large means for them). It's easy to put off most of those smaller fires and rarely these make it to the news. If we consider those larger fires then we are back to a large role to be attributed to lightning strikes (by number of fires and area) and a scarily large fires of unknown cause. I did try to get the MTBS the authors of the "it's mostly us" paper used but the dataset doesn't contain the cause of the fires. But yes, most sources tend to agree that out of the known causes of fires, less than 10% are attributable to nature, so we could be preventing a good amount of those wildfires (see e.g. p. 55 of this). 98% of all fires are stopped before they grow larger than 300 acres and plausibly most of those are in areas most accessible to firefighters, closer to urban areas and mostly caused by humans.
- Power line fires as a surprisingly small amount of the total fires, compared to other causes (unless many of those 'Unknowns' are actually power lines. In the dataset I found two fires (Thomas and Witch) that had been classified as Miscellaneous but are now seen to be caused by faulty power lines)
- Around the Los Angeles area, almost every fire is due to human-causes. In North California most of the fire tends to be due to lightning and around the Bay Area there's a combination of both.
- In the span of 2000-2020 there doesn't tend to be much overlap between fires: what has burned does not burn again (perhaps up to 10 years after the original fire). It should be possible to do a more detailed analysis of this with the FRAP data given more time. In some areas trees are not coming back (Stevens-Rumann, 2019), with the terrain being converted to chaparral. In turn, chaparral is being converter to grasslands and sage scrub (Syphard 2018)
- Highways are good but imperfect firebreaks; there is a 4-lane wide section of the I-5 that had a fire spreading across it. Even this freeway with multiple levels and more lanes than you can possibly count was not able to stop the Saddle Ridge fire of 2019.
- Prescribed fires are on the rise, in accordance to various proclamations and commitments by public authorities. Perhaps not as much as there should be (discussed later) but directionally in the right direction.
Who is in charge where?
California's land ownership, at a simplified level is split between
- Private landowners (~40%)
- Government
- Local government
- The State of California (2.25%)
- Federal government (45.4% of all land, main agencies below)
- Bureau of Land Management (BLM, 33%)
- US Forest Service (FS, 45%)
- US Park Service (PS, 16%)
- Department of Defense (DoD, 3.7%)
Starrs et al. (2018) have a convenient chart showing who owns what, and importantly, who is responsible for fighting fires where. In State areas, it will be CALFIRE doing the firefighting whereas for federal land it'll be firefighters from any of the agencies that manage the relevant land:
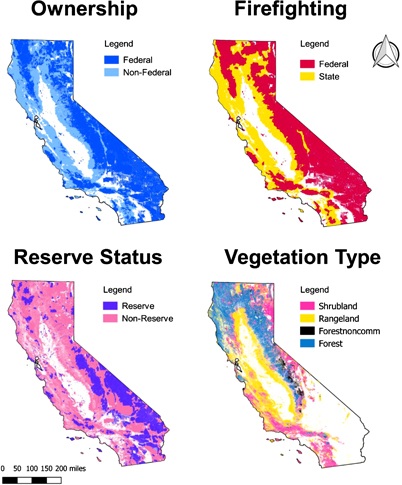
The author hint at the possibility that who manages the land matters,
Our results clearly demonstrate that non-federal lands have seen far less of an increase in fire probability than have federal lands. Our results also showed a consistent pattern of lands with federal firefighting—regardless of ownership or reserve status—nearly always having a higher fire probability than lands with state firefighting
There is no single "fire czar" in California; in lieu of that there's a California Master Cooperative Wildland Fire Management and Stafford Act Response Agreement that states and aims to solve the obvious problems like
Lands for which the State and Federal Agencies are responsible for wildland fire protection are intermingled and/or adjacent in some areas, and wildland fires on these lands may present a threat to the lands of the other.
It is to the mutual advantage of the Agencies to this Agreement to coordinate efforts in the investigation, prevention, detection and response to wildland fire, and projects related to fuels management including prescribed fire in and adjacent to their areas of responsibility. This improves efficiency and effectiveness and limits duplication.
And institutes a bunch of cross-agency entities, mainly the California Wildland Fire Coordinating Group which is the closest California have to a single entity in charge for the entire territory. The agreement effectively pools all firefighting resources into a single loosely held coalition. However what it does not do is to effectively unify forest management practices across agencies. This is why, if an agency runs out of money for prevention activities, firefighters from another can't just jump in to do their job in their stead,
So real work on the ground to reduce the intensity of fires isn't getting done or is being delayed," says Ken Pimlott, the director of Cal Fire. "It really just further exacerbates the intensity of fires because we can't get on the federal ground in particular to get the fuels treated.
To make it worse, tree NIMBYism is a thing, and so proposed activities to manage a forest (e.g. prescribed burns) often face opposition;
Creating solutions is complicated by the array of overseers of wildlands — a tangle of federal, state and local agencies and thousands of private owners. A permit to cut or burn any parcel might stall if public officials can’t answer concerns about air quality, water purity, wildlife preservation and cultural and historical preservation.
As an example of this (Thanks to Eli Dourado who is always there to point out how troublesome NEPA is:)
An Environmental Impact Statement and Decision Notice were released in May of 2001. The project was subsequently appealed. At the appeals resolution meeting, eight individual landowners requested the appellants withdraw their appeal, which they did not. The project decision was upheld in August of 2001. The appellant filed a complaint with Federal District Court to permanently enjoin the project which was granted. A hearing date was set for October of 2003; however in July of 2003 approximately 45% of the project area burned in a running crown wildfire. The chronology (Exhibit 2) of this project shows how process and procedural delays hamper the ability to get on top of forest health restoration needs especially when treatment needs are time sensitive. Often delay is the objective of individuals or groups that do not want to see any trees harvested.
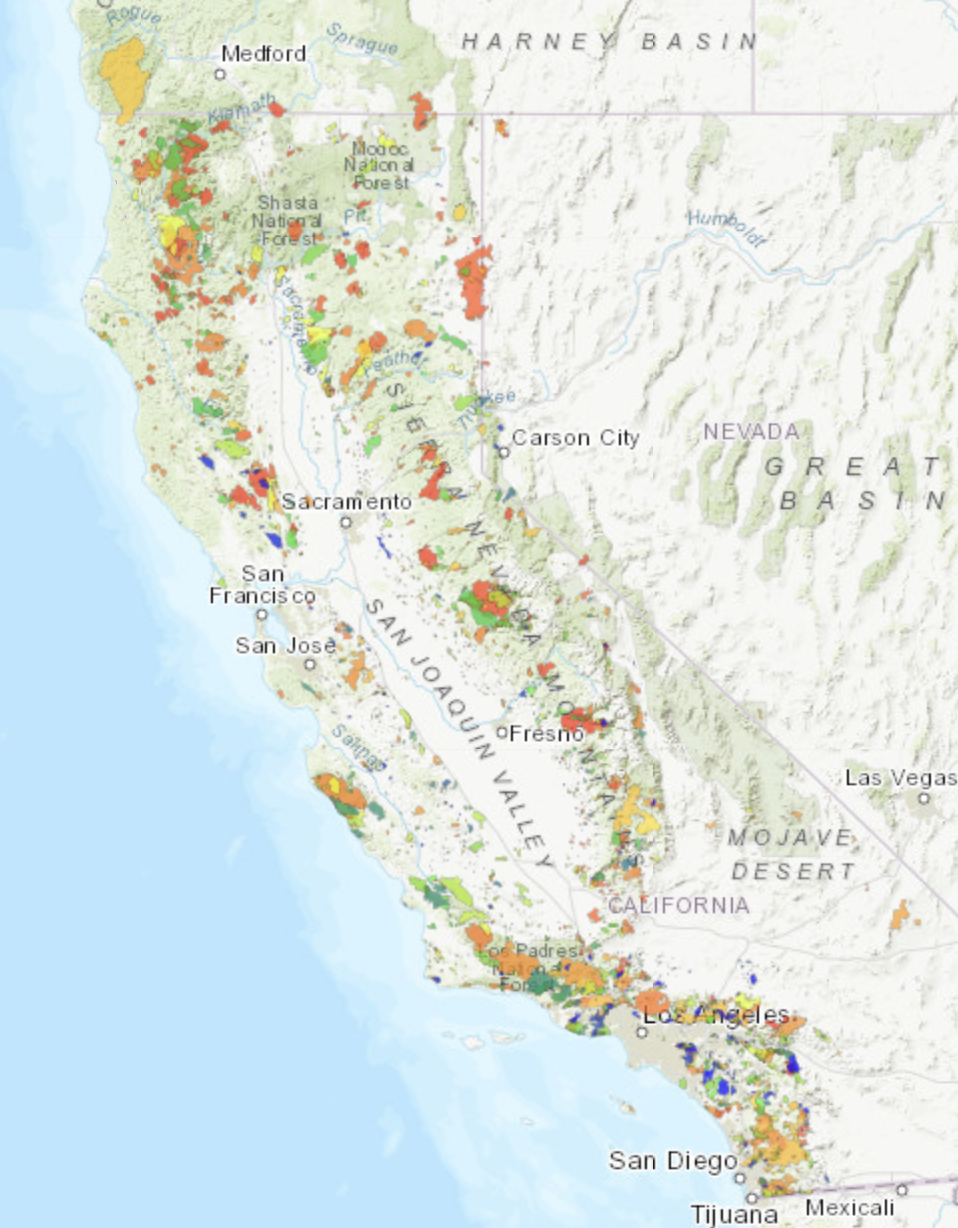
The image below, taken from the California Public Utilities Commission shows historically where fires in California have occurred. Hover over the image to see areas deemed to be of high risk. They largely match and with the exception of the Central Valley (which is basically a relatively humid area literally tiled with farms) the entirety of California is at risk.
Trends elsewhere. Is it getting worse in general?
There are not good records of the distant past in the US in general or California specifically. But there might be for other countries. Canada shows a declining number and area of wildfires over the years after an increasing trend culminating in the 90s. Like the US, Canada engaged in a policy of fire suppression up until the 70s, but maybe they transitioned more aggressively to prescribed burns? Spain (Urbieta et al., 2019; Montiel-Molina et al. 2019) and the Mediterranean region more broadly are seeing less fire despite increase risk of fire (due to better management techniques), but not in Australia (Where there's an upward trend in some areas that's partially but not fully due to climate change).
Globally, there is a trend towards fewer, but larger fires (Doerr & Santin, 2016). The concluding section, in line with the "fire deficit" idea from earlier is worth quoting at length because back then they make the claim that there was no trend: and that may have been true once but not anymore (the article was written in 2016).
Few studies exist that have explicitly examined trends in fire severity. These have mainly focused on the western USA, an area where there are particular concerns about increased fire activity [42,70]. Examining trends from 1984 to 2006 for large ecoregions in the north- and southwest USA, Dillon et al. [71] found no significant increase in the proportion of annual area burned at high severity for five of the six regions considered, with the southern Rockies being the exception. For the Sierra Nevada region (California), which was not covered in the previous study [71], Hanson & Odion [72,73] found no general increase in fire severity within the period 1984–2010. Considering ten national forests in California for the same period, Miller & Safford [74] found a significant increase in burn severity for yellow pine–mixed conifer forests. They attribute this largely to decades of fire suppression and other management practices rather than climate, which have led to major changes in forest composition and structure, increases in density and fuel-loading, and hence fire behaviour. Covering the much larger area of the dry forest landscapes of the western USA, including large parts of those examined in the aforementioned studies, Baker [75] found that the rate of high-severity fire in the period 1984–2012 was within or below that of historical century- to millennial-scale estimates.
Thus, while there is evidence of a recent increase in proportional fire severity for a specific forest type in California, these independent studies do not support the notion of an overall increase in fire severity over the past few decades in the fire-adapted forested landscapes in the western USA. Indeed, a longer term perspective focused on the Californian Sierra Nevada and Cascades by Mallek et al. [49] suggests that the annual area burned at high severity between 1984 and 2009 was only half that prior to European settlement (approx. 1500–1850), associated with an overall smaller area burned compared to pre-European times. Whether or not the overall lack of change in burn severity applies also to other regions where perceptions of increases in fire severity exist too has to remain unanswered until robust data emerge to test this notion.
Fire suppression, fire exclusion and prescribed fire
The set of activities that have as a goal extinguishing fires called fire suppression. Fire exclusion on the other hand the a policy putting off all fires as fast as possible, and not starting any new fires. By default wildfires would burn until it there is no more fuel to burn but this is not ideal as all that fire can generate pollution, and loss of life and property. So it seems natural to want to suppress every single fire. Fire is kind of scary and hard to control.
But this is one of the Talebian cases where systems require some volatility to stay more stable than otherwise. It is now commonly agreed that such policies (fire exclusion) are bad: they allow for too much fuel to accumulate, leading to larger and more devastating fires.
After a series of large fires in 1910 the US decided it had gotten enough of that and aimed to prevent any and all fires from ever happening. In 1935 a policy was instituted such that every fire should be suppressed by 10 a.m. the day following its initial report. Why even fight wildfires in the first place? It was not so much safety or health concerns, but an economic one: burnt forests are not forests you can profit from by logging them. Now that logging and wood-related activities are a minor part (~1%) of California's GDP (39 billion/ 3 trillion) this justification is weaker, compared to the other considerations (like health and protecting life and property).
In 1970 a reversal of these policies started, and now the consensus position is that starting some fires is can be a valuable tool (Stephens & Ruth, 2005).
The early Forest Service was not stupid; they did commission studies about whether or not to engage in prescribed burns, and after years of debate the answer back then was no: Any fire was deemed too dangerous,
That maximum protection or fire exclusion inevitably increases hazard by the encouragement of undergrowth is, of course, true, but such added hazard in no way vitiates the reasons for protection. It is an additional danger, but one that can willingly be accepted. (Show & Kotok, 1924; see also Keeley, 2021 who notes that part of the reason the policy was put into place seems to be some amount of lobbying by the logging industry: burnt trees are less valuable)
But despite official proclamations that prescribed fire is okay now, it still seems to be not as practiced as most reports say it should. I guess because changing firefighting culture takes more than saying 'We have a different culture now'.
Shortly after the NPS revised its fire policy, the USFS did so as well. Henry Debruin, Director of Fire and Aviation Management for the USFS, stated ‘‘we are determined to save the best of the past as we change a basic concept from fire is bad to fire is good and bad’’ (DeBruin 1974:12). While this statement represented a major shift in the philosophy of the USFS, fire suppression was still to dominate agency policy for the coming decades (Franklin and Agee 2003). (Stephens & Ruth, 2005)
Even in 2020, one can still find articles talking about bottlenecks in further pursuing this policy (Miller et al., 2020). Not only California is not doing enough prescribed burns, but it's not even doing the ones that are planned (dashed line is planned, black is actual). At least it's trending up:
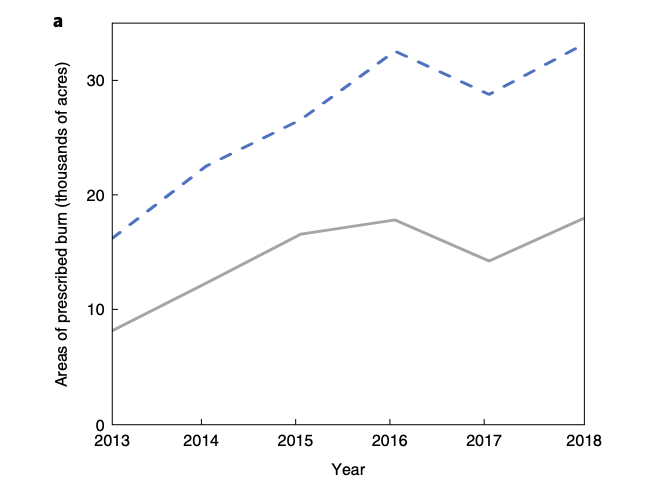
But the 30k acres burned in 2018 are not enough: The California Department of Forestry and Fire Protection estimated in 2010 that 20 million acres would require treatment. Even when upping the yearly burn to 100k acres per yer it would still take 200 years to get all the burning done. The number Miller et al. actually call for is 1.01 million a year, which is substantial, around 20% of the total surface that burned in the 2020 wildfires.
So what's preventing California from reaching that target? Miller et al. asked a range of stakeholders:
- In federal lands, it's possible to let wildfires burn if deemed necessary (it can serve to clear up fuels). In areas managed by CAL FIRE, that is illegal: the agency has to extinguish all unplanned fire. Enabling CAL FIRE to leverage wildfires for treatment purposes ("managed wildfire") would be a big step forward. However, most of the land in need of treatment is federally owned, so this is not a huge key bottleneck. In Sierra Nevada, the US National Park Service (and not so much the US Forest Service) has been leveraging wildfires for treatment to great affect, to the point where the area treated by managed wildfire is similar to the area undergoing prescribed burn in the years 1968-2017 (Keeley et al., 2021)
- Although heralded as the future of fuel treatments by most interviewees, it remains unlikely that managed wildfire will be used on state and private land in the near future due to legal responsibilities and the need for cross-jurisdictional agreement. Interviewees therefore underscored the importance of expanding prescribed burns, particularly on non-federal lands, to achieve the ecological benefits of fire.
- Most of the land in need of prescribed burn is federally owned
- If the a prescribed burn escapes (and 1.76% does), there are substantial legal and financial penalties imposed on the burner. This was addressed by SB 1260 which exempts them from liability if the burn meets some safety criteria, including passing a certification course that was made available starting in 2018.
- In federal lands, managers that use prescribed burns don't receive any upside, but are personally liable if their fires escape.
- There are not enough trained crews to do all the needed prescribed burning required
- The California Air Resources Board (CARB)'s burn windows are too narrow. CARB says they offer more burn days than the ones that end up being used; landowners on the other hand says CARB is too restrictive. Presumably because when there's availability of a team to do the burn is not when CARB is allowing it. One could relax air quality regulations for prescribed fires: temporary worsening on a schedule (so the affected population can prepare) is better than multi-month bad air quality. But interviewees declined to ask for weaker environmental regulations for prescribed fires. The California Air Resources Board is aware of the need for more prescribed fire and back in 2019 they were calling for "Significantly increase the number of acres treated with prescribed fire. " or to "Streamline regulatory and permitting processes.". Currently prescribed fires take place in favorable weather (think wind), which is why there is less of an impact to nearby populations (Xiaoxi et al., 2017), but burning all that is required to burn probably will require making transitory exceptions to this air quality regulations.
- Environmental regulations like NEPA and CEQA impose a heavy burden on justifying the burns, decreasing their use. If the approved burn window is missed, they have to reapply for approval.
- There seems to be high level state-level support for prescribed burns
- The authors judge the overall mix of policies and solutions being implemented at too conservative and unlikely to meet the required fuel treatment goal.
The firefighting trap
In any one given year, a firefighting agency has to allocate resources between fighting fires and preventing them. In some platonic scenario, one models what's going to happen by doing each activity and how that affects fire hazard over time, and allocates resources accordingly.
This is not how agencies operate in reality. For example CAL FIRE has no choice but to extinguish any and all fires under its area of responsibility regardless of any other consideration, the only real constraint being firefighting crew availability. The crews that do prevention also do suppression and with a lengthening fire season, the money and crews that would otherwise be preparing for the next season are fighting the current one. The firefighting trap (Moreira et al., 2020) is the situation that happens when fighting fires in the short term, at the expense of disregarding prevention and preparation for future fires, yields an increasing amount of fire. Breaking this cycle of self-defeating firefighting practices would involve potentially politically hazardous actions, like modifying CAL FIRE's charter to allow them not to intervene in wildfires, or even not to intervene by default unless there fire is predicted to cross a certain threshold of expected damage. Savings from this policy would allow prevention activities to take place more often. More realistically, CAL FIRE should have a ring-fenced budget for one and other kinds of activities, but even then, is it politically acceptable to have some crews working unmolested on prevention projects while other crews are desperate for reinforcements miles away, trying to save lives? The temptation to shift resources to suppression activities is always there.
Were Native Americans doing it?
A point I encountered repeatedly is that Native Americans were engaging in prescribed burns before it was cool the arrival of Europeans to America. There seems to be some political coding around prescribed fires, where "prescribed fires is how to solve the problem, the government made it worse" is the conservative position and "actually, wildfires are due to climate change" is the progressive position.
Adding that "Native Americans were doing it" may be an attempt to make the position sound more progressive and natural sounding or something (where prescribed fire is a return to ancestral practices). Be that as it may, were they really?
Native Americans indeed used fire for various reasons, from religious to clearing land to increasing agricultural yield to reducing places where rival tribes could hide and ambush (Keeley, 2002). But the extent to which these practices affected large swathes of territory remains debated. For what's worth Keeley does think that the practices did lead to substantial amounts of fire, enough to shape large parts of the region.
What seems to be the authoritative book on the subject Indians, Fire, and the Land in the Pacific Northwest (Boyd, 1999), says that indeed the Indians were not really engaged in the deliberate prevention of fire, rather to the extent that they were causing there to be fewer larger fires, it was an accidental outcome of their use of fire for other purposes,
Other ecological effects of burning and other traditional management practices that are apparent today may not have been so obvious or primary in the world of the Native Americans. The beneficial effects of understory and spot burning in several forest types as a preventive to wildfires, disease outbreaks, and extensive forest burns, now so apparent to Northwest forest managers, have become timely because of the ill-advised, unnatural (and culturally specific) practice of fire suppression
I'm agnostic as whether these practices were enough to substantially alter the landscape of California at large. Ultimately I think of the practice of prescribed burning as aiming not to give the environment what it "naturally needs"; nature does not do prescribed burning, rather it's an attempt to first undo what the longstanding fire suppression policy (also an alteration over the natural course of things) did, and make California a more livable place than what nature would let us have: maybe more fires, but in safer ways with less pollution and damage.
So is it fire exclusion or climate change?
There is only a handful of paper trying to consider climate change and fire exclusion jointly. Hanan et al. (2021) examine two different locations (Johnson Creek and Trail Creek) in Idaho using the most detailed model of coupled hydrology-fire-ecology-climate that I've seen so far (RHESSys-WMFire) and... it's complicated. Fire exclusion (zero-tolerance policy against fire) can both worsen and improve the number and area of fires. And the same is true for climate change! This latter result is because while increasing aridity makes for more flammable fuels, at some point of increased aridity (and for a given vegetation type), the growth rate of new vegetation is stunted and so one gets less fires.
Fire regimes—characterized by the frequency, intensity, size, season, and severity of fire over time— exist along an aridity continuum that ranges from being limited by flammability (i.e. climate) to being limited by fuel (Krawchuk and Moritz 2011, Pausas and Paula 2012). In climate-limited systems, there is typically enough fuel for fire to spread, but moisture is too high; these systems are characterized by infrequent, severe fires, which occur during unusually arid conditions. In fuel-limited systems, the climate is relatively arid and conducive to fire, so fire activity is mostly driven by the amount of live and dead plant material present; these systems typically experience frequent, low-severity surface fires.
Could it then be that the "fire deficit" is actually caused by climate change, rather than fire exclusion? This is very unlikely: If California as a whole were at the point the vegetation-reducing effect of aridity overwhelms the fire-inducing effect we would see an inverse correlation between aridity and fire in the last few decades; but the Abatzoglou et al. papers cited above show otherwise: Right now more aridity means more fire.
Conclusion
Here I have reviewed various strands of evidence regarding what's going on with wildfires in California and where it is going. I have explicitly not gone into what should we do about the matter, that will come in part 2 of this series. To sum up, this is what is going on:
- Burned acres per year in California are increasing relative to 1950. This is predicted to continue to increase, but the increase won't be linear. Some years will see very little fire and others will see 2020-scale mega fires.
- This quantity of fire is not unseen in the history of California: pre-1800 there used to be more fires, and during the European colonization California saw even more fires.
- The immediate cause of most (>80%) fires is attributable to humans. However, this is not true for large fires. Lightning strikes continue to play a significant role in igniting fires and should not be disregarded. There is no one main contributor to wildfires. See the plethora of "miscellaneous" explanations.
- The practice of zero-tolerance fire suppression, or fire exclusion, has led to a buildup of field throughout California. This compounded with a particularly wet period leading to strong plant growth coupled with lower fire incidence. The combination of the end of this wetter period, and rising temperatures due to climate change is what has led California to the current situation.
- Even in the absence of climate change, we would still see more fire than the 1950-1980 period; that is, the graphs typically used to point to the effects of climate change on the increase of wildfires overstate the magnitude of the effect of climate change and understate natural variation and human firefighting practices.
- It seems to me, though showing this at length would require making this post even longer, that Californian institutions are weak. Some kinds of regulations (Getting PG&E to behave, building fire-safe WUI houses) and are not enforced either at the individual or the corporate level. This explains the disconnect between various action plans and roadmaps detailing measures being implemented, and what is actually happening on the ground. The ideas are in the right documents, but they are not being translated into actions.
- California is preventing market mechanisms (i.e. insurance) from fully operating to prevent construction in highly fire-prone areas
- There is a systematic and comprehensive lack of good quality information in general about what's going on with wildfires, including the cause of many of them!. This is repeated throughout the Cost of Wildfire in California (2020) report. Ideally there should be a central website containing easy to access datasets, predictive models, incident reports, budgets, and so forth, adequately sourced and updated.
- The right question to ask is not whether the driver is climate change or fire suppression looking back. The right question to ask is what to do moving forward, especially accounting for various political and social constraints. Even without climate change, fire exclusion, or weather oscillations, a lot of California is going to naturally burn. The questions then become:
- How much of California should burn, given what Californians care about? Rather than accepting the default amount of acres burned in a pristine California untouched by us.
- How do we get there?
Further questions
The post was getting somewhat long so I've left some interesting questions unexplored here.
- What's going on with PG&E?
- Does aerial firefighting, or more broadly, various firefighting practices work in a cost-effective way?
- What's the state of the art in modeling fires? If a fire starts in a given location, what can we say about how it will spread?
- Assuming perfect compliance with construction codes, does that matter? How should communities be built to be truly fire-adapted
- Some trees need fire to survive (seeds are released from e.g. cones after a fire). How should this be factored in?
- Some authors point to the presence of more fire-prone invasive species in California. How much of a deal is this compared to the other factors?
Changelog
- 2021/06/30: Removed " By the way fire works (what has burned will not burn again for a while; more on this later) there cannot be many years of consecutive megafires." (This is somewhat true for one area but not true in the aggregate; thanks to Grant Manon). Clarified that I am not making claims regarding trends of lightning strikes in the 2000-2021 period. Various replies in the comments (highlighted yellow) about the causal role of climate change.
- 2021/07/04: For some reason I said that deaths from health-related reasons in the 2018 fire season were 10x direct deaths. It's actually 35x (Thanks to Kathryn Myronuk). Added one more further question (About the need of some trees for fire). Added another question about invasive species.
- 2021/07/08: Added link to article on construction materials and fire
Thanks to Alexey Guzey for comments and review
Citation
In academic work, please cite this essay as:
Ricón, José Luis, “Wildfires in California (I)”, Nintil (2021-06-28), available at https://nintil.com/wildfires-california/.
Comments