Epigenetic clocks: A review
It has recently been found possible to estimate age, mortality risk, or general health by looking merely at the epigenome. The models used to do so are referred to as epigenetic (or methylation) clocks.
Epigenetic clocks are increasingly becoming a popular choice for scientists in the field of aging research to measure the putative efficacy of anti-aging interventions. They may make it possible to get results before full Kaplan-Meier curves are available, and they could serve, at least seemingly, as a replacement for a host of other biomarkers. I recommend reading the introductory sections of The Longevity FAQ as well as those about epigenetics before reading this post as it gives some more context.
Epigenetics
As a quick recap about epigenetics, the epigenome is a set of modifications to the DNA that do not alter the genetic code itself but regulates its expression and that enable cells to dynamically regulate their functions and maintain distinct states. Epigenetic marks take various forms, chiefly methylation of CpG sites—this is when a methyl group is attached to a C that is followed by a G—and also histone modification. Histones are proteins that form octamers around which the DNA is coiled. These histones have tails to which modifications can be made; typically acetylation (which opens up the chromatin and facilitates gene expression) or methylation (which can act both as a repressor and promoter of gene expression). Of particular interest is histone methylation induced by the Polycomb Repressive Complex (PRC), as these ones are easier for the cell to switch on and off relative to methylating or demethylating CpGs (Bell et al., 2019).
Most of these CpGs (70-80%) are methylated in mammalian tissue1 (Janitz & Janitz, 2011), but if one breaks looks only at clusters of CpGs, known as islands, only 6-8% of the islands are methylated in any one given tissue in humans (Illingworth et al., 2008): Given all the kinds of cells there are, a given cell only needs a fraction of the genes to be active to do its functions. CpG methylation patterns are not meant to change much in the adult. Once the cell is fully differentiated, the cells seems to assume everything is going to stay fine with these CpG methylations, and so it mostly loses the capacity to methylate additional CpGs, and/or their ability to protect (maintenance methylation) the methylated CpG islands is reduced (Cedar and Bergman, 2009, Jeltsch & Jurkowska 2014).
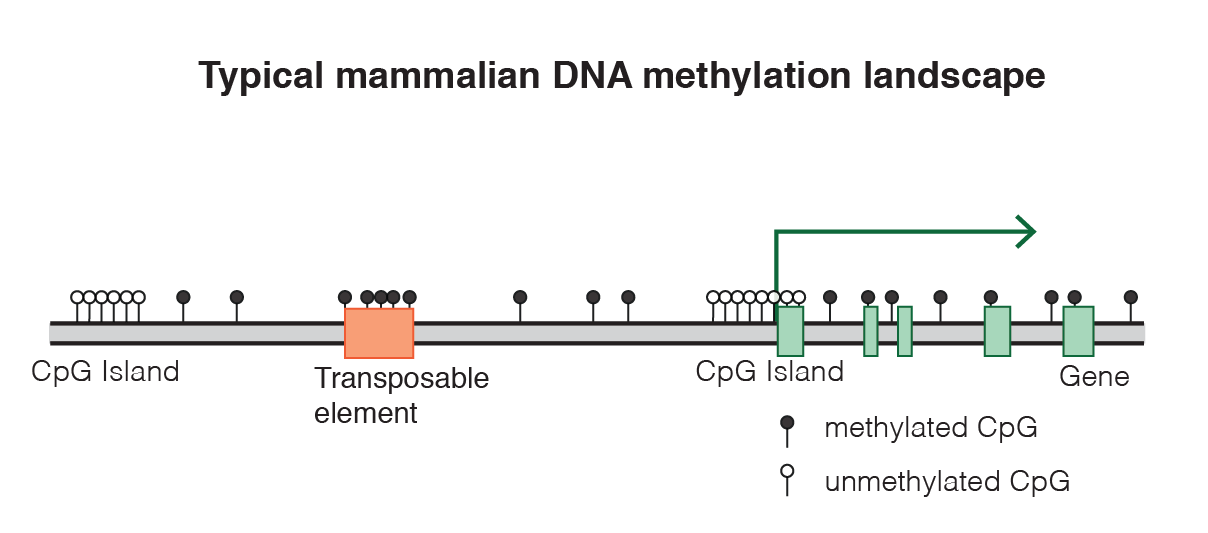
As we age, a distinct pattern emerges in the CpGs: The islands that were methylated and supposed to stay so begin to lose their methyls, and extraneous methylation marks appear too where they are not supposed to be. It is still unclear if this happens in every cell or in a subset, as that would require single cell epigenetic sequencing studies that have not been done yet. And it is also important to remember that the CpGs that researchers have looked at until now for correlations with age are a small subset of the set of CpGs across the entire genome, looking at a few hundred at a time in general. Even the most advanced methylation microarray (the Illumina MethylationEPIC) can only assess 850k sites, 3% of the total count of CpGs).
The approach seems a promising research avenue: This pattern of aging occurs to some extent across species and this pattern seems to not be a mere reaction to damage outside of the cell but an intrinsic property that persists even when the young cells are transplanted to an old body or vice versa (Søraas et al. 2019).
The extent to which various conditions (such as replicative senescence or repeated passaging) affect epigenetic age depend on the clock that is being used to measure said age. And even then the interpretation of the results is not obvious; for example Horvath (2013) says that A significant correlation between cell passage number and DNAm age can also be observed when restricting the analysis to iPS cells or when restricting the analysis to ES cells. This does not seem to me to be the case from the figures they have (Figure 5H). In a later review (Raj and Horvath, 2020) the same data is interpreted in what seems to me a more reasonable way, extensive passaging of stem cells up to even a hundred times is not accompanied by increase in epigenetic age. When contacted, Ken Raj told me that
The reference can indeed cause confusion. While there appears to be a statistical correlation between ESC proliferation and age, this is not the case, when the data points are compared to the spread of ages of these cells, for which the vast majority are of pre-natal age regardless of the number of times they are passaged. Importantly I [Ken Raj] have repeated this experiment in my laboratory and can categorically confirm that proliferating ESC (and also iPSC) do not undergo epigenetic ageing. The new data will soon be published.
As embryonic stem cells are immortal (Saez et al. 2018) the result that they do not epigenetically age makes some a priori sense. The probable outcome is that they do age, but very slowly, in a way echoing the results found for gametes and DNA mutations: They suffer them, but orders of magnitude less than the rest of cells.
According to the Horvath clock used in Horvath (2013) and related work, senescent cells don’t show up as aged in the clocks if senescence was induced via radiation or oncogene suppression; it is only in those cells that stay alive for long enough that they get epigenetically aged. Even if the cells are immortalized with telomerase, they still epigenetically age. Likewise, faster replication doesn’t make cells age faster; say you have a cell that in a period of time replicates itself faster and another that replicates slower, you then test the epigenetic age of cells in both populations at the end and they are similarly aged.
However this is not the case for all the clocks, and there are ongoing efforts to explore the effects of various conditions of epigenetic age, and better conceptualizing epigenetic age itself. The choice of sites to measure for clock design matters greatly; in a later section I discuss the variability of some results depending on what clock, and on what tissue, the methylation data is obtained from.
A brief walk through the epigenetic clocks
Conceptually, epigenetic clocks are very simple2 . One starts from CpG methylation data and an endpoint of interest, such as age or mortality risk. Then one fits an elastic net model (a mixed L1/L2 penalized linear regression) so ultimately one gets \(DNAmAge=a+b1CpG_1+b2CpG_2+...\). This is good to frame a conservative case for the clocks: Unlike with fancier statistical techniques it is hard to fudge results using elastic nets; there are fewer hyperparameters to tweak, and being a simple model it is harder to overfit a training set.
The endpoint of interest initially was age, so one tries to predict age from the epigenome: The first such attempt (What later would be referred to as "the original Horvath clock") was Bockland et al. (2011), looking at 88 CpG sites, and already achieving a decent correlation (.85) with chronological age.
Two years after that is what Hannum (2013) did looking at 71 CpGs in the first batch of analyses. Note that clocks don’t just use the epigenome, Hannum also used various controls like age-adjusted BMI, gender, diabetes status, ethnicity, and a dummy for the dataset the data was taken from.
Horvath (2013) later did another clock based on 353 CpGs samples from various tissues; this time he used exclusively methylation and nothing else; but he used a function to transform age; this is the price to pay when working with linear models, one sometimes has to do some feature engineering to improve the model. This is justified because it does seem like epigenetic age, when plotted, has a logarithmic relation with age (Snir et al., 2019), initially there is rapid growth, then it slows down.
Levine et al.(2018) used a single dataset that unfortunately is not as easily available as the patchwork of datasets that Horvath put together (InCHIANTI and NHANES III) to come up with a composite metric, PhenoAge; as the the output of a model that aims to predict the 10-year mortality risk out of a set of phenotypical covariates of aging (albumin, creatinine, glucose level, CRP, lymphocyte %, mean red cell volume, red cell distribution width, alkaline phosphatase, white blood cell count, and age itself), so PhenoAge is correlated with, but not the same as, age; for example PhenoAge can be highly negative in some tissues. From here it’s the same elastic net model as in the Horvath paper. Here 513 CpGs were used. To find a metric to a mortality analysis that is not correlated with age (Age being a significant confounder in predicting aging, of course), they trained a linear model to predict age from PhenoAge, and then calculated the difference between that and chronological age (DNAm PhenoAgeAccel). It is this measure that they used for predict mortality risks.
GrimAge (Lu et al., 2019) used the Framingham Heart Study as training set and a different set of intermediate variables: They first train a model on methylation data to predict smoking pack-years and the levels of various proteins in blood, then using those estimates they trained another model to estimate time to death. In total, they used 1030 CpGs. As in the Levine paper, here an acceleration metric, AgeAccelGrim is similarly derived. As is discussed later, this clock has so far achieved the best results when it comes to predicting mortality.
As a wrapup, it’s worth mentioning that in retrospective, clocks tend to be grouped into first generation (Horvath and Hannum) and second generation (GrimAge and PhenoAge). The latter have a markedly higher accuracy predicting morbidity and mortality (Levine, 2020). One reason for this is that the earlier models have a built-in bias in their dataset: They are trained on cross-sectional data (You take a sample of people of various ages, get their CpGs and train the model) while the second generation clocks include longitudinal data (From the same set of people, tracked over time). For example, imagine there is one CpG that strongly correlated with early death. In a cross-sectional dataset you may only see that CpG in a small sample of the younger subjects; as the older ones would be dead, so you would have no way to know that that CpG later on has such a causal impact. As in the GrimAge paper, here we also find an age acceleration metric.
When looking at hazard risks from the clocks one should take care when reading the study, as publication bias has been found, per Fransquet et al. (2019) for the Horvath and Hannum clocks (Which in any case one should not use for predicting mortality, that’s why one’d prefer GrimAge and PhenoAge)
At this point you may be thinking: Why keep using elastic nets? Why not throw neural networks at it! Of course, that has also been done, albeit only recently. Levy et al. (2020) not only published a deep-net based epigenetic clock, but also made freely available the processing pipeline for other to reuse. However, as is the case with GWASes, a nonlinear model doesn’t improve much on the linear models; it seems there aren’t that many interactions between CpGs so at the end of the day performance is better than Horvath’s clock at predicting age, but not that much.
Something else someone might think is that these are referred to as methylation clocks, yet I’ve only been talking about CpG methylation. Why? Because it’s easier to get CpG methylation; non CpG methylation is rare (initially thought not to exist even), though it may be relevant in some tissues or organs like the brain (Lister et al., 2013)
There is also work that directly addresses the question of comparing the clocks on the same dataset. In a recent preprint, McCrory et al. (2020) again remark that second generation clocks work better to predict age-related conditions. However, when it comes to predicting all-cause mortality (In a 10 year followup in this case), it is only GrimAge that shines. One standard deviation increase in the AgeAcccelGrim score increases the odds of not making it past 10 years by 18%. PhenoAge does a bit better than the first generation clocks but the increase ends up being statistically nonsignificant. The paper presents two models when examining each clock, one unadjusted and another adjusted for some other covariates (age, “social class trajectory”, smoking history, physical activity, hazardous drinking, or BMI). The relations weaken when one applies these controls. It shouldn’t be necessary to control for age as the acceleration measures by construction are not related to age. Controlling for the other factors could be problematic.
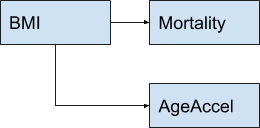
As an example, consider BMI. What is the causal association between BMI, epigenetic age acceleration, and mortality? So far we’ve been just talking about correlations, so various causal diagrams are compatible with what we have found. It could be:

This graph actually represents two possibilities: BMI only causes AgeAccel (In which case controlling for BMI does nothing to the association between AA and mortality), and BMI causes mortality directly and also through AgeAccel (In which case controlling for BMI would get a better estimate of the AA-Mortality correlation).
But it could also be like this:

In this case AgeAccel causes mortality partially through BMI (Imagine the damaged epigenome disregulates metabolism). In that case controlling for BMI would attenuate a legitimate correlation and would leave us with just the direct channel (If there is one).
It could also be
In this case there would be a correlation between mortality and AgeAccel but it would not be causal! This leads us to the question of causality. Is an aged epigenome causing aging? Or is it aging that causes an aged epigenome?
In which way does causality run?
Here we would want to manipulate the epigenome directly and see if we observe an aged phenotype. If we don’t then it means that the aged epigenome is a mere epiphenomenon and not something one can causally use as a target in drug development. Experiments to directly do this have not been done yet, so we only have indirect evidence.
David Sinclair mentions an experiment done with “ICE mice” (Inducible Changes to the Epigenome), genetically engineered mice that express on demand a gene that causes DNA double stranded breaks. On Sinclair’s theory, sirtuins—what they do is deacetylate proteins, mostly histones; and in turn this allows the chromatin to be more tightly packed, reducing gene expression around the deacetylated site—are typically acting to diminish gene expression in specific sites. But when there is a DNA (double-stranded) break, there is a need for deacetylation in the break which draws the sirtuins there to aid in the repair, but this reduces their deacetylating activity elsewhere: Genes that should be silent then become expressed.
Thus the ICE mice allow one to indirectly damage the epigenome through damaging the genome. Compared to a control group of ICE mice that had not been induced DNA damage, they were 50% older epigenetically. Phenotypically they showed all sorts of age-related conditions as loss of fur, body mass, muscle strength, or increase in arthritis and loss of sight.
Another example is epigenetic reprogramming: Genetically engineering mice that inducibly and transiently3 express a set of genes—OSKM factors - that would generally move the cell towards an undifferentiated state—led to an increase in maximum and median lifespan (20 and 33% respectively) in progeroid mice. This shows up as rejuvenation in the epigenetic clocks (An example would be Figure 2e and Figure 2h of this preprint from the Sinclair lab). The OSKM paper from the Izpisua-Belmonte lab at the Salk Institute uses an antibiotic to trigger the OSKM factors, so one might think that perhaps the antibiotic is what causes the improvement in lifespan, but they had controls for precisely that. In the Sinclair lab paper, again in mice, they also looked at whether or not OSK4 is having its rejuvenating effects through remodeling the epigenome, so they tried to knock-out Tet1 or Tet2 (enzymes that promote demethylation) and the effect was greatly reduced5 , suggesting that the effects were mediated through epigenetic changes. In the paper, they cause an injury to the optic nerve in mice and then they treat the eye with the OSK factors. Besides observing regeneration of the nerve, they observe rejuvenation as measured by an epigenetic clock; and conversely upon inflicting damage they observe an increase in epigenetic age. The same is true for human neurons when damage is done to their axons and then treated. But damage does not sound like aging, so why does it show up in the clocks?
There are at least three competing views as to what drives the ticking of these clocks: One is that it is just epigenetic noise that randomly gradually degrades the informational content of the epigenome. But another is that it reflects a programmed set of instructions that either causes aging (this is what the programmed aging camp claims) or that merely is a response to aging.
Naively, it would seem like the Sinclair group is not right in saying that epigenetic aging is an increasy in noise in the epigenome. After all, if the clocks work and they are picking up the same CpGs across individuals, that means aged epigenomes are similar; if it were just noise we would expect each individual to exhibit a distinct pattern6 . Furthermore it’s not just humans, it has been possible to design clocks that work across species, and Horvath claims he will have one this year that works for all mammals he tested. But this outcome is not that surprising: After all, methylated sites will tend to lose methylation and unmethylated sites, to gain it. It's not random gaussian noise but instead noise that brings the informational content of the epigenome to a mushy disregulated homogeneity.
So what does the evidence say? Is it noise that causes a degraded epigenome? Or is it a regulated process?
Field et al. (2018) note that the CpGs that are picked up by the clocks are not localized anywhere in particular, the islands they are in are all over the place, with some being shared and others being tissue-specific7 . As in the Sinclair paper, conditions and damage that are not necessarily tied to age make the epigenome look older (ovariectomy or a high fat diet in mice, in humans, insomnia or stress); conversely interventions that are known to promote lifespan (like rapamycin or CR) slows down the clocks. Some authors referenced in the paper have suggested that the patterns observed are consistent with an informational loss model where methylation becomes more uniform: Sites that should be methylated become unmethylated and vice versa.
However other authors have pointed out that this is not concordant with the changes the clock pick up all the way from the embryo through puberty. On this view, aging would be programmed, as the lack of damage so early in life would rule out the changes in methylations being a response to it. Field et al. dismiss this explanation as there are other explanations available, and programmed aging (in the group-selection sense) is hard to explain on evolutionary terms.
In contrast, Horvath (2013) proposed an epigenetic maintenance system (EMS) which the clocks would be picking up: The changes would be tied to how hard the system is working. During maturation in utero, with many changes happening, the clock ticks faster, but this would mean that the EMS has to do extra work to keep the epigenome stable.
More recently, Raj and Horvath (2020) seems to reject the idea that the patterns observed are due to damage or noise
It is worth digressing a little at this point to consider an important implication of this notion. An intuitive assumption of ageing is that it is not an intrinsic property of life, but an extrinsically induced feature, which is encapsulated in the term “wear and tear”. The fact that epigenetic ageing clock starts ticking very soon after the embryonic stem cell stage, prompts a re-assessment of this perspective. The evidence suggest that processes related to ageing are already afoot at the start of life. The involvement of DNA methylation changes to specific CpGs indicates that this is a very precise process that is inconsistent with entropy or random- ness, which is the nature of damage. It is important to consider, however, that these changes are meant to develop the organism. Hence, the ageing process is a continuum which begins after the embryonic stem cells state through to death. Therefore, the essence of ageing might well lie in understanding why developmental processes inadvertently contribute to ageing of the organism. It is important to note that although wear and tear or damage-related events appear not to be the “prime-mover” of epigenetic ageing, they do nevertheless affect the rate of epigenetic ageing.
Instead, the ticking of the clock may be related to the differentiation of stem cells into non-stem cells
One could posit that the ticking of the clock is a measure of asymmetric stem cell division, i.e. when one of the daughter cells become a transit-amplifying cell, its DNA methylation profile changes and this is manifested as alteration of the methylation profile of the tissue—the ticking of the clock. As stem cells are in low abundance and undergo infrequent division, the DNA methylation changes of tissues that occur in time would be very small, which is indeed observed for the ticking of the epigenetic clock. This scenario would suggest that were stem cells to be isolated from tissues (free of transit- amplifying cells and fully differentiated cells) and analyzed, their DNA methylation profiles would indicate much younger epigenetic age than the tissue. This was indeed observed in a recent report showing that muscle stem cells isolated from mice were epigenetically much younger independently of the ages of the tissue/animal from which they were derived. Likewise, small intestine and colon crypts, in which stem cells reside have younger epigenetic age than the upper portion of the tissue which are devoid of stem cells. Although these do not by themselves constitute proof, it is nevertheless consistent with the notion that ticking of the epigenetic clock is constituted by methylation changes that accompany the differentiation of stem cells into non-stem cells (such as transit-amplifying cells). [...] The multi-tissue age predictor shows this difference to be on average, 0.032, which translates to 3.2% of the cell population. This suggests that increase in epigenetic age is contributed by changes of methylation profiles in a very small percent of cells in a population.
This cannot be the whole story though. If a tick in the clock occurs when stem cells replicate, why would damage to cells age non-stem cells? The solution to this is that probably there is more than one cause for the observed pattern; one component might be related to the loss of epigenetic information during stem cell differentiation and/or symmetric replication, another could be a response to damage. There is an ongoing effort to categorize and cluster the different kinds of sites that the clocks are picking up and to assess the functionality of those sites (Liu et al., 2019).
Finally, Raj and Horvath's assertion that observed patterns in the clocks are not easily reconcilable with "wear and tear" is not compelling. If aging is, as they say, related to lossy replication of epigenetic information in stem cells then that mechanism would still be active right after the first embryonic stem cells are formed. We would be aging right from when we are born.
How good are the clocks, compared to something else?
To finish off, it is important to compare the clocks to other methods to do what the clocks do. For assessing chronological age as noted earlier the correlations are so high so as to put the relevant clocks (Like Horvath’s) among the top if not the top method to assess age. In the original Horvath clock, the average error is ~ 3.6 years.
For mortality things get more interesting. Sarah Constantin has compiled here a list of Hazard Ratios (HR) for various biomarkers. The idea here is to take a biomarker, in this case a measure of epigenetic age, take the top 5% and the bottom 5% scorers and do a ratio of how likely each group is to die on a given period. A good biomarker should have a high ratio, meaning that it is able to effectively discriminate between those that have higher and lower risk. A poor biomarker would have a HR=1, where knowing the value of the marker doesn’t give any information at all about relative risk. With that said, the GrimAge clock is the best clock to predict mortality so looking at it, the ratio in hazard ratios between the top 95 and bottom 5 in AgeAccelGrim (Difference between expected epigenetic age and real age), from the original paper is 4. This places it right at the top of the list as the best predictor there is in general8 . For an intuitive comparison, the hazard ratio for mortality of smoking vs not smoking is 1.9 for smokers of 10 cigarettes a day relative to nonsmokers (Jacobs et al., 1999), so this again shows that clocks are indeed reliable tools when they are trained on the endpoints of interest.
Do longevity interventions known to work affect the clocks?
If we know rapamycin extends the lifespan of mice, if we give them rapamycin we should see an increase in their predicted lifespan in the clocks similar to that empirically observed for a cohort of rats. Does this happen?
At first, it seemed that no. Thompson et al. (2018) constructed 4 multi-tissue clocks for mice, finding accuracies comparable to other lifespan clocks of around 80%. The results were somewhat heterogeneous: They found positive effects for caloris restriction: calorically restricted mice were 5 months younger (per the clocks) than mice fed a regular diet. With rapamycin they didn't find an effect, fact they attribute to the small sample size (Just 4 mice in each group) or using a different sequencing technique .
Ames dwarf, which have achieved large (65%) increases in their maximum lifespan showed up as being epigenetically younger too, however the authors note that not all the clocks picked this up. I want to include here the rapamycin figure to also bring up the fact that the result might also have been a statistical fluke due to a single outlier:
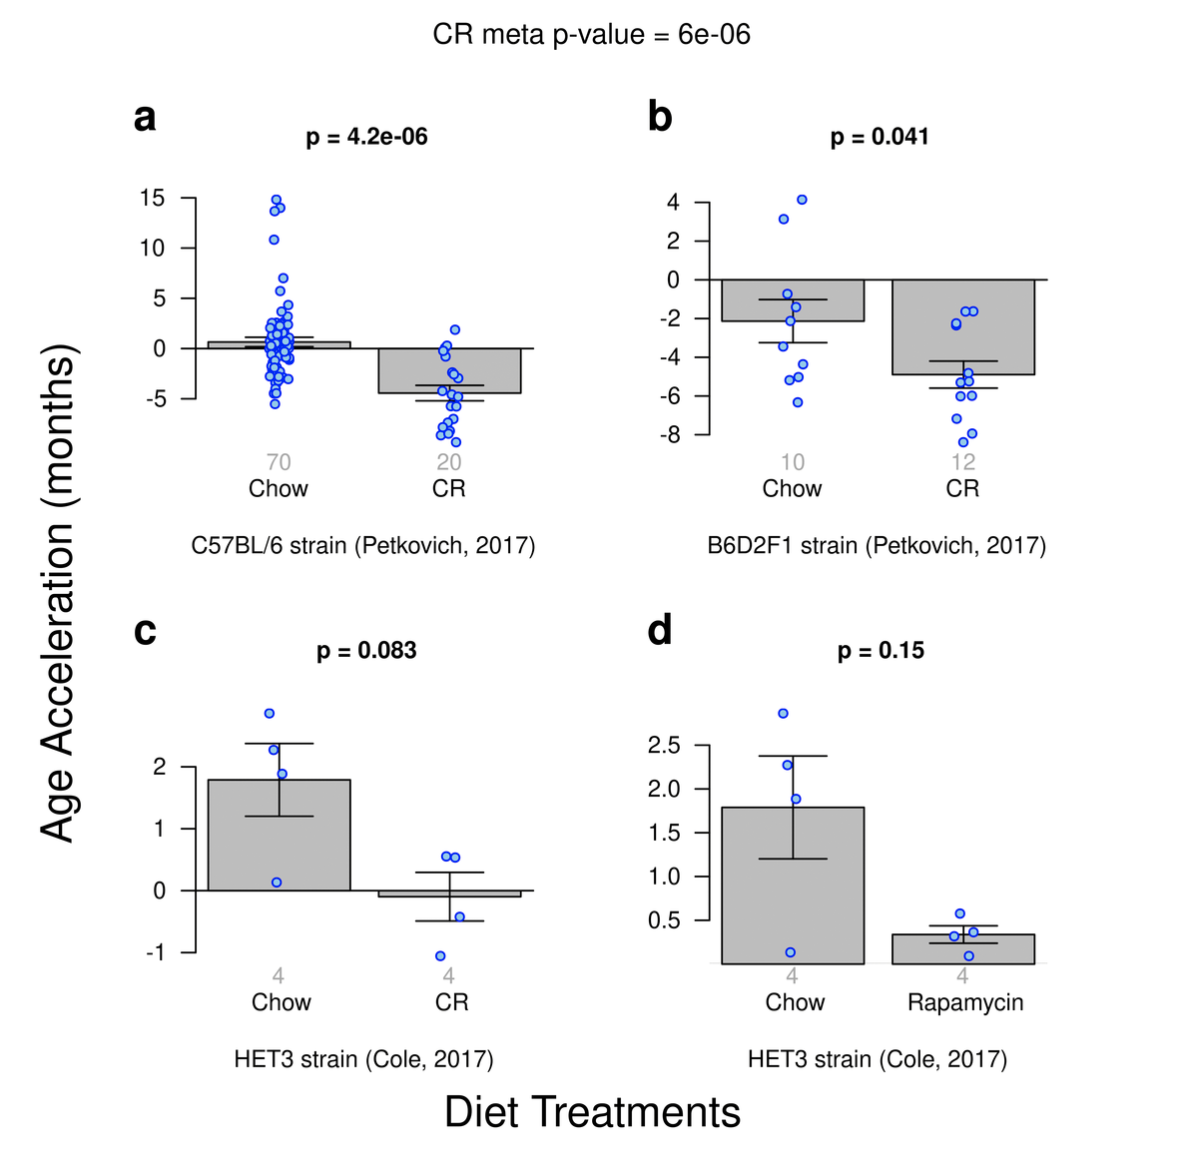
If you take out the odd outlier in the Chow group, then a result for rapamycin would be observed. Still, the effect ends up being smaller than for caloric restriction. Given this, we shouldn't disregard the clocks just yet; we should look at more studies. And also, this clock is not the one we want to assess lifespan interventions: We want something that's like GrimAge, trained to predict specifically years of life remaining.
Fortunately there are more studies:
Using 107 mice methylomes and 148 CpGs and normalization applied to account for the different sequencing methods, Wang et al. (2017) they developed a clock trained to predict age. Here they found uniformly larger differences: 9.4 decrease in epigenetic age as the effect of caloric restriction for age-matched mice, and 6 months for rapamycin, showing that perhaps CR mimetics may not be as good as CR itself. Young Drwarf Ames mice were slightly epigenetically younger than regular Ames mice, with older mice being 15 months younger, a result more intuitively coherent with the extended lifespan of these mice.
Petkovich et al. (2017) did a blood-based clock and found 20% lower epigenetic ages for calorically restricted mice; Dwarf mice appeared to be 50% younger, consistent with teir reported extended lifespan.
In yet another mice multitissue clock, Meer et al. 2018 instead split their predictions by tissue. For Snell Dwarf or CR mice the blood-based clock predicted its lifespan advantage. Oddly for Ames Dwarf mice (contrary to Petkovich) the lifespan effect was only found in a liver clock, a fact the authors attribute to the fact that
fewer than 90% of CpG sites used by other DNAm estimators were covered in these samples, while in the other intervention tests all clocks had high sites representation: more than 90% for each sample and more than 95% on average. Another reason for the failure to detect slowdown of aging in these samples might be that DNAm levels were estimated using WGBS. While the liver methylation clock was trained on both WGBS- and RRBS-produced samples, three other models studied here did not use WGBS-produced samples for training and thus they were expected to perform worse on these samples.
In a completely different context (and thus harder to extrapolate), rapamycin also shows up in the clocks in human cells in vitro (Lujan et al. 2019, Horvath et al., 2019).
So yes, looking at more rigorous tests involving cohort studies and experimental manipulations, methylation clocks work.
Conclusion
Even with a small number of the CpGs of the epigenome measured, it has been possible to construct clocks that accurately track age and health. We still don't know exactly why the clocks work, just that they do. There is some interesting evidence pointing out to at least part of the pattern seem in the aged epigenome being causal, not just a reflection of the overall condition of the tissue or organism, so we may soon see the epigenome becoming a target for novel drugs.
If you want to continue reading about this, Bell et. al's review (from where I extract the table below) and Raj and Horvath 2020 are the best starting points.
| Significant issue | Current problem | Potential solutions/advances |
|---|---|---|
| Biological age measures. No single measure or “gold standard” of biological age is likely to be possible | Simultaneously measuring multiple contributing biological processes that are changing with age | Focused analysis on specific components of aging biology and/or specific age-related diseases |
| Prediction versus mechanistic insight | Predictors are by design not optimal for mechanistic insight but are nevertheless used | Separate prediction (using sparse CpG sets) from mechanistic studies (based on whole DNA methylome/integrated epigenome) |
| Age-associated changes in non-dividing cells | Uncertainty over mechanism and current ability to dissect apart intrinsic (intracellular) from extrinsic (whole tissue) changes | Analyze aging in single cells. Also, determine whether construction of single-cell clocks is possible |
| Confusion between epigenetic correlations of aging and the aging process itself | Aging is a complex multi-systemic process. Specific evidence is required that the epigenetic changes observed in DNA methylation clocks are driving the aging process itself | To reduce confusion for those outside the epigenomics field, publications need to be clear that epigenetic observations usually only represent a biomarker of aging |
| Bias of DNA methylation clock training sets | Uncertainty of the contribution of deviation between predicted and actual age to biological aging or prediction error. Clocks trained on small samples are prone to confounding by cell composition | Larger studies, as well as increasingly focused tissue/disease-relevant clocks and cell type-specific information |
| Contribution to DNA methylation clock signals of cell type proportions and rare cells and/or clonality | Uncertainty whether cell type deconvolution increases or decreases biomarker power for different diseases | Refined single-cell analysis to separate tissue cell proportional changes from intrinsic cell changes for specific diseases. Also, purified cell type analyses and further refinement of cell type deconvolution methodology |
| Pan-tissue aging changes | Separation of true pan-tissue changes from cell proportion changes | Single-cell analysis to identify cell proportion changes from individual cell changes. Also, purified cell type and statistical cell type deconvolution analyses |
| Aging-related increased variability in DNA methylation versus directional changes | Difficult to deconvolute intrinsic from extrinsic changes in heterogeneous cell type-derived DNA, as well as to delineate technical from biological variation | Single-cell analysis to differentiate cell proportion from individual cell changes. Use of multiple technical and statistical methodologies to dissect origin of variability, including deep-targeted BS-seq and third-generation sequencing |
| Construction of a clock at the single-cell level | Currently technically challenging, particularly due to missing data in each individual cell | Imputation may be helpful, but ultimately improvements in single-cell analysis will be required |
| Identification of disease-related changes | Uncertainty whether capturing the most disease relevant changes | Improved methodology: latest array increased enhancer CpGs focus—improved high-throughput power to identify tissue-specific and disease-specific loci. Also, increased deep BS sequencing |
| Disease mechanism is unknown | Role of aging-related epigenomic deterioration contributing to age-related disease pathology is not appreciated | Discovery of disease-related mechanisms through disease-relevant cell and tissue-type epigenomic analysis of aging-related changes |
| Regulatory role of DNA methylation is more complex than classical models | Complex interplay between transcription factors and epigenomic factors impacts on outcome within different functional loci (promoters, enhancers, insulators, transcribed regions, etc.) | Detailed experimental evidence within specific genetic loci and in disease-relevant cell types, including appropriate disease stressors, to infer potential repressive and/or activating roles |
| Differentiation between DNA methylation loss due to reduction in active processes required for maintenance, or active enzymatic-driven loss | Firm evidence required in appropriate cell types of decay without cell division. May be more prevalent at dynamic enhancer regions. Neuronal cells have high post-mitotic expression of DNMTs and TETs plus high 5-hydroxymethylcytosine (5hmC) | Detailed models studying DNMT and TET expression in disease-appropriate cell types. Assaying the specific products of TET activity, such as 5hmC |
| Functionality of DNA methylation changes is often assumed | Crossing statistical significance thresholds does not infer function. Statistical differences between quantitative and categorial measures | Acknowledged functional evidence deficiency in results and that further integrated disease-relevant tissue genomic/epigenomic/transcriptomic analyses in appropriate models are required |
| Low reproducibility of DNA methylation clocks in model organisms reduces the utility of published clocks | Technical issue because of the reliance on low-depth sequencing due to the lack of available commercial DNA methylation arrays in non-human species | Higher-depth base-resolution sequencing studies are required to improve portability of DNA methylation clocks between experiments. Also, new methodology robust to stochastic missing data |
| Aging DNA methylation sites are only partially conserved among different mammalian species | Reduced insights to be made from comparative studies | Integrative whole epigenome analyses to identify common mechanistic processes |
| Role of DNA methylation and rare modifications, such as 5-hydroxymethylation (5hmC) in specific functional loci, such as enhancers | Large-scale base-resolution analyses currently performed using bisulfite conversion. This does not differentiate between 5hmC and 5mC | Oxidative bisulfite sequencing and new methodologies, such as a non-destructive DNA deaminase, and third-generation direct modification analysis |
| Interconnected role of DNA modifications and chromatin modifications | Unknown directionality and causative effects of cross talk between these different epigenomic modifications | In vitro, organoid, and model organism evaluation of epigenetic machinery with age. Integration of DNA modifications, histone post-translational marks, and transcriptional data into a single integrated aging model |
| Population variation in DNA methylation clock measures | Genetic variation may be influencing clock measures directly, or impacting on relevant causative factors, such as inflammation and immunological aging | Integrating genetic effectors into clock and age-related measures, including haplotypic information. This will also lead to insights into causal or mechanistic pathways |
| Many different DNA methylation clock models | Many available clocks and ad hoc application and interpretation of results can result in suboptimal robustness of findings | Systematic evaluation of methods with a priori assumptions about the meaning of associations of various measures |
| Forensic use of DNA methylation clocks to determine legal age | Robustness of DNA methylation clocks across populations, tissues, and environments is unknown. Furthermore, the impact of acute and chronic inflammatory processes needs assessment | Assess variability by the analysis of large, diverse, and well-powered datasets in the range of tissues likely to be employed (whole blood, buccal cells, etc.) |
| DNA methylation clocks as a de facto measure of an individual’s “health” | Associations with biological aging are cross-sectional and epidemiological. Accuracy within an individual and in other populations the clock is not derived from is unknown | Longitudinal studies required to assess clock changes within an individual over time. Requires appropriately powered studies across diverse populations. Re-commercialization—public must be protected by provision of accurate data regarding estimate/error rates |
Thanks to Adam Marblestone for helpful comments, references and the initial prompt to write this post.
Changelog
- 2020-06-14: Noted that the OSKM mice are progeroid. Added explanation from Ken Raj.
- 2020-07-16: Added explainer about rapamycin and others
- 2020-10-09: Removed Schultz clock (It is based on frailty, not methylation!)
- 2021-06-17: (Thanks to Morgan Levine)
- 2022-02-17: I forgot to cite Bocklandt et al. as the first paper that did an epi clock, and cited the Horvath pan-tissue clock as having being published in 2015, but it was published in 2013
- 2022-02-25: Typo fixed
Citation
In academic work, please cite this essay as:
Ricón, José Luis, “Epigenetic clocks: A review”, Nintil (2020-06-16), available at https://nintil.com/epigenetic-clocks/.
Comments